eDebug
Web-based debugger for Bash scripts with breakpoints and variable watching
Gallery
About eDebug
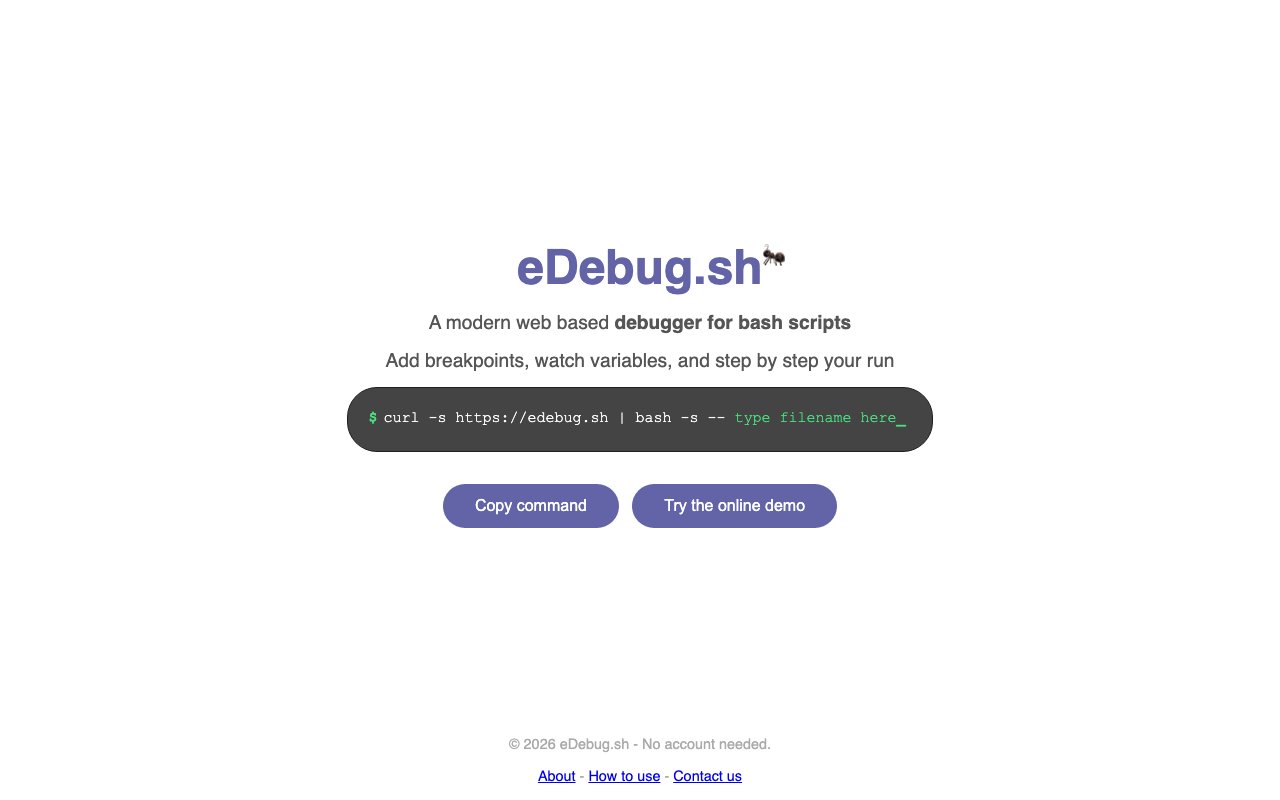
eDebug is a web-based debugger built specifically for bash scripts, bringing the kind of interactive debugging experience developers expect from modern IDEs to shell scripting. Shell scripts have always been harder to debug than code in other languages. There's no built-in debugger in bash that matches what you get with Python, JavaScript, or any compiled language. Developers typically resort to echo statements scattered through their code, set -x traces that produce overwhelming output, or manual inspection of intermediate files. eDebug changes this by providing breakpoints, variable watching, and step-by-step execution through a visual interface that runs in your browser. You see exactly what your bash code is doing at each stage of execution, with full visibility into variable state.
Shell scripts often start as simple automation but grow into complex systems that handle deployments, data pipelines, backup routines, or server administration tasks. A script that began as ten lines to restart a service becomes five hundred lines managing multiple services, checking dependencies, handling errors, and logging outcomes. When something goes wrong in a script of that size, tracking down the issue can mean inserting print statements throughout the code, running the script repeatedly with different inputs, and piecing together what happened from scattered output across terminal sessions. eDebug replaces this trial-and-error approach with structured debugging. You set a breakpoint where you suspect the problem lies, run the script, and examine the state of every variable when execution pauses. Then you step forward one line at a time, watching how values change.
Installation happens through a single command piped from the eDebug website, keeping setup minimal. The cloud-based architecture means there's no local debugger daemon to install, configure, or maintain. Your scripts run with the debugger attached, and the web interface communicates with the execution environment to control flow and retrieve state. This approach works particularly well for scripts running on remote servers or in cloud environments where installing traditional debugging tools might be impractical, restricted by security policies, or simply more hassle than it's worth. You can debug scripts on production servers, in containers, or across SSH sessions without pre-installing anything beyond the initial curl command.
The variable watching capability addresses one of the most tedious aspects of bash debugging and probably saves more time than any other feature. In traditional bash debugging, you might add echo statements for every variable you care about, rerun the script, scroll through output to find the values, realize you forgot to print something important, add another echo, and repeat the cycle. With eDebug, you declare which variables to watch, and their values update in real time as you step through code. You see immediately when a variable takes an unexpected value, remains empty when it should have been populated, or gets overwritten by a later assignment. String manipulations, command substitutions, and arithmetic operations all become visible in their results.
Breakpoint functionality lets you skip past the parts of your script that work correctly and pause execution exactly where problems occur. This is especially valuable in scripts that process files, iterate over large datasets, perform network operations, or execute time-consuming commands before reaching the problematic section. Rather than waiting through the entire execution or temporarily commenting out earlier code blocks (and hoping you remember to uncomment them later), you jump directly to the relevant lines and inspect state from there. You can set multiple breakpoints to catch execution at different points, comparing state across locations to understand how values evolve.
Step-by-step execution reveals control flow that can be surprisingly opaque in bash. Conditional statements with complex test expressions, nested loops, function calls, subshell operations, and pipe chains all become visible as discrete steps you can observe individually. When a script behaves differently than expected, stepping through shows exactly which branch of an if statement was taken, how many times a loop iterated, where a function returned early, or how subshell variable scoping affected your values. This visibility transforms debugging from educated guessing into methodical inspection where you can verify assumptions against reality.
The positioning as a cloud debugger reflects how scripts are actually deployed and run in modern infrastructure. Automation runs across distributed systems, inside containers, on serverless platforms, and through CI/CD pipelines where you may not have direct terminal access. Being web-based means you can debug from any machine with a browser, without needing the same local environment where the script runs. For teams managing automation across multiple servers, cloud providers, or container orchestration systems, this accessibility removes friction from the debugging workflow. An online demo is available directly on the eDebug website for developers who want to try the interface before integrating it into their own scripts.
Key Features
- Breakpoint setting in Bash scripts
- Variable watching during execution
- Line-by-line step-through debugging
- Browser-based interface
- Single-command installation
- No account required
Pros & Cons
What we like
- Proper debugging for a language that lacks built-in tools
- No installation beyond one curl command
- Web interface works from any browser
- Free to use without signup
Room for improvement
- Script execution goes through external service
- Requires internet connection to debug
- Not suitable for scripts with sensitive data
- Limited to Bash, not other shells
Frequently Asked Questions
What is eDebug?
Is eDebug free?
How do I use eDebug?
Is it safe to debug sensitive scripts with eDebug?
Best For
Featured in
Alternatives to eDebug
View all
1Lookup
Real-time data verification API for phone, email, IP, and domain validation to fight fraud

Kevin Gabeci
Solo developer building web apps, cozy browser games, and AI creator toolkits.

Codedex
A gamified, story-driven platform that teaches Python, web dev, and more like an RPG quest
Hack2hire
Practice real SDE interview questions from top tech companies with expert worked solutions
Reviews (10)
Quietly excellent
Tried eDebug on a side project first, then rolled it out everywhere. Their take on variable watching during execution is genuinely good. It fits well for tracing variable values through build automation.
Two months in, no regrets
Started using eDebug casually, now it is pinned in my dock. Got real value out of proper debugging for a language that lacks built-in tools. Support actually answered when I had a question, which surprised me. Found it works best for teaching bash scripting with visible execution.
Does the job, a few gripes
Hadn't planned on switching, but eDebug was hard to ignore. Got real value out of free to use without signup. One thing that bugs me is not suitable for scripts with sensitive data. Worth it for what I get out of it.
Worth a look
Found eDebug on a Show HN thread and I am glad I clicked. What stands out is how it handles line-by-line step-through debugging. Worth it for what I get out of it.
Exactly what I needed
eDebug has quietly become part of my daily flow. The thing I keep coming back to is how reliable it is. Found it works best for stepping through failing ci pipeline scripts. Worth it for what I get out of it.
Recommended without reservation
eDebug has quietly become part of my daily flow. What stands out is how it handles no installation beyond one curl command. Mostly using it for tracing variable values through build automation. Glad I made the switch.
Finally something that fits
eDebug solves a real problem for me without making a fuss about it. It does what it says, which is rarer than it should be. Mostly using it for debugging complex deployment scripts. Recommending it to people in a similar spot.
Good, with a few caveats
Started using eDebug casually, now it is pinned in my dock. Where it really wins is proper debugging for a language that lacks built-in tools. It has shaved real time off my week. My only gripe is not suitable for scripts with sensitive data.
Exactly what I needed
Three months of eDebug later, here is what holds up. Got real value out of proper debugging for a language that lacks built-in tools. It does what it says, which is rarer than it should be.
Exactly what I needed
eDebug solves a real problem for me without making a fuss about it. Got real value out of single-command installation. Mostly using it for debugging complex deployment scripts.
Badge builder
Add eDebug to your website
Choose a badge style and size, preview it here, then copy the generated HTML. Badge images are self-contained SVGs and do not require an external script.

<a href="https://toolindex.net/tools/edebug?ref=badge" target="_blank" rel="noopener">
  <img src="https://toolindex.net/badge/edebug/medium.svg" alt="eDebug - Listed on Tool Index" width="180" height="50" />
</a>How to use the badge
- 1. Pick the style, size, and theme that fit your layout.
- 2. Copy the generated HTML from the code block.
- 3. Paste it into your footer, homepage, or press page.
Standard badge available
The standard listing badge is available now. Score and circle badges are limited to tools currently ranked in the top 10 of a category.
Badge clicks return visitors to this profile with a referral tag so the source remains identifiable.
Related Tools
Kevin Gabeci
Solo developer building web apps, cozy browser games, and AI creator toolkits.

Coolify
Self-hostable, open source alternative to Heroku and Netlify

Warp
The modern terminal reimagined with AI and collaboration

Bolt.new
Prompt-to-deployed full-stack app inside the browser
Work on eDebug? Request listing access or correction