
Oversold
Compare stock valuations, fundamentals, scenarios, and long-term trends
Gallery
About Oversold
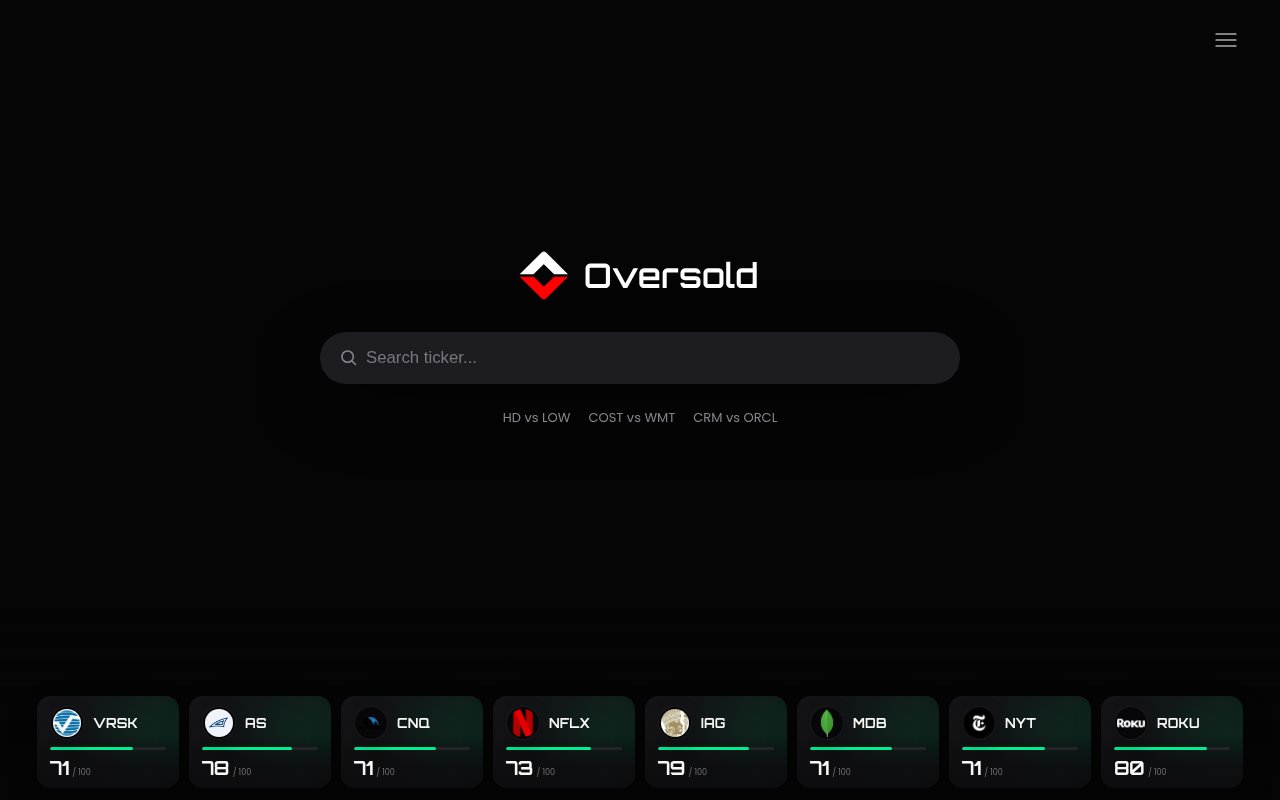
Oversold is a stock research site that turns a large set of fundamental and market data into a compact scorecard. Search for a ticker and it summarizes valuation, cash flow and growth, possible upside, and possible downside before opening the supporting charts. Two companies can be placed side by side on the same page, which makes it easier to compare the shape of each business without moving between separate reports. The product is aimed at investors who want a fast first pass on a stock, then enough detail to understand where the summary came from. It is research software, not a broker, portfolio manager, or personalized financial adviser.
The headline score is broken into parts instead of appearing as an unexplained recommendation. Valuation compares the company's current earnings multiple with its own historical record, while a forward outlook adjusts that reading for expected earnings growth. A high multiple can look more defensible when growth expectations are strong, and a low multiple can look less attractive when the outlook is weak. Cash flow and growth use trailing revenue growth, earnings growth, operating margin, and free cash flow. Missing inputs reduce the coverage of the score rather than being treated as zero, so a thinly reported company isn't automatically presented as a weak one. Oversold also explains in plain language whether valuation looks cheap, fundamentals look strong, or the outlook carries a notable concern.
Scenario estimates add another layer to the quick read. A favorable case combines projected earnings with a multiple informed by the company's valuation history and outlook. A downside case considers weaker earnings and a lower amount investors may be willing to pay, while a financial resilience score reflects debt and cash flow coverage. The site labels the resulting figures as scenarios rather than price targets or forecasts. That is an important boundary. These figures can help someone frame a range of outcomes, but they don't predict what the market will do. Oversold's own disclaimer says the service isn't a registered financial adviser and that its content should not be treated as a recommendation to buy or sell a security.
Below the scorecard, the report exposes the underlying context through focused tables and charts. Historical comparisons place the current price-to-earnings ratio, earnings per share, and free cash flow beside past averages. Other views cover trailing diluted earnings per share, quarterly revenue and margins, free cash flow, diluted share count and buybacks, and net leverage. A sector chart compares the company's earnings multiple with its sector average. Weekly price charts add RSI and Stochastic momentum, while moving-average charts span several time windows and yearly return lines show how separate calendar years developed. These views bring fundamental and technical context together without pretending they measure the same thing.
The side-by-side report keeps the same structure for both selected companies. Each retains its own score breakdown, historical comparisons, forward outlook, scenario explanations, and detailed charts. That makes differences in valuation and growth easier to inspect without collapsing the pair into a single winner. The outlook also reports the breadth of analyst coverage and how widely estimates differ, which gives important context to confident-looking projections. Someone can see where the two reports use comparable measures and where the quality or agreement of the available inputs diverges.
Oversold also works as a discovery and monitoring tool. Its top-stock view ranks companies with cheap valuations, solid fundamentals, and strong forward outlooks, and the list can be filtered across sectors such as technology, healthcare, energy, finance, real estate, and utilities. A daily email offers the highest-ranked stock each morning. Signed-in users can create an alert by choosing a stock, a field, a condition, and a value. The site says it sends one email when the condition is met. This is useful for following a threshold without checking the report every day, although it is not presented as a streaming trading terminal or a system for executing orders.
The public site exposes search, rankings, reports, comparisons, and sign-in for alerts, but it does not publish a pricing page or advertise a paid plan. That supports treating the current product as free, with the caveat that its future pricing posture is not documented. The main limitation is the judgment built into any composite score. Oversold explains many of the ingredients, but a concise number can still hide accounting quality, industry structure, management decisions, and events that are not captured by historical multiples. It is most useful as an organized research starting point. A buyer should still verify the source data, read company filings, and make decisions based on their own circumstances rather than treating the score or scenario range as advice.
Key Features
- Multi-factor stock scorecards
- Side-by-side company comparisons
- Historical valuation analysis
- Fundamental and technical charts
- Sector-filtered stock rankings
- Condition-based email alerts
Pros & Cons
What we like
- Explains the components behind each stock score
- Combines fundamental history with market trend charts
- Compares two tickers on one detailed page
- Provides sector rankings and threshold alerts
Room for improvement
- Composite scores still require independent judgment
- Scenario ranges are not price forecasts
- No published explanation of future pricing
- Doesn't replace filings or professional advice
Frequently Asked Questions
What is Oversold?
How does Oversold score a stock?
Does Oversold provide investment advice?
Is Oversold free?
Best For
Featured in
Alternatives to Oversold



Reviews (0)
Badge builder
Add Oversold to your website
Choose a badge style and size, preview it here, then copy the generated HTML. Badge images are self-contained SVGs and do not require an external script.

<a href="https://toolindex.net/tools/oversold?ref=badge" target="_blank" rel="noopener">
  <img src="https://toolindex.net/badge/oversold/medium.svg" alt="Oversold - Listed on Tool Index" width="180" height="50" />
</a>How to use the badge
- 1. Pick the style, size, and theme that fit your layout.
- 2. Copy the generated HTML from the code block.
- 3. Paste it into your footer, homepage, or press page.
Standard badge available
The standard listing badge is available now. Score and circle badges are limited to tools currently ranked in the top 10 of a category.
Badge clicks return visitors to this profile with a referral tag so the source remains identifiable.
Related Tools

Simple RMD
Calculate, aggregate, and manage your annual IRA required minimum distributions.
FreshBooks
Cloud accounting designed for service-based small businesses and freelancers
Deel
Global payroll, contractor, and EOR platform
Chargebee
Subscription billing and revenue management for B2B SaaS
Work on Oversold? Request listing access or correction