
Ticker Line
Embeddable market sparkline SVGs for stocks, crypto, forex, and commodities
Gallery
About Ticker Line
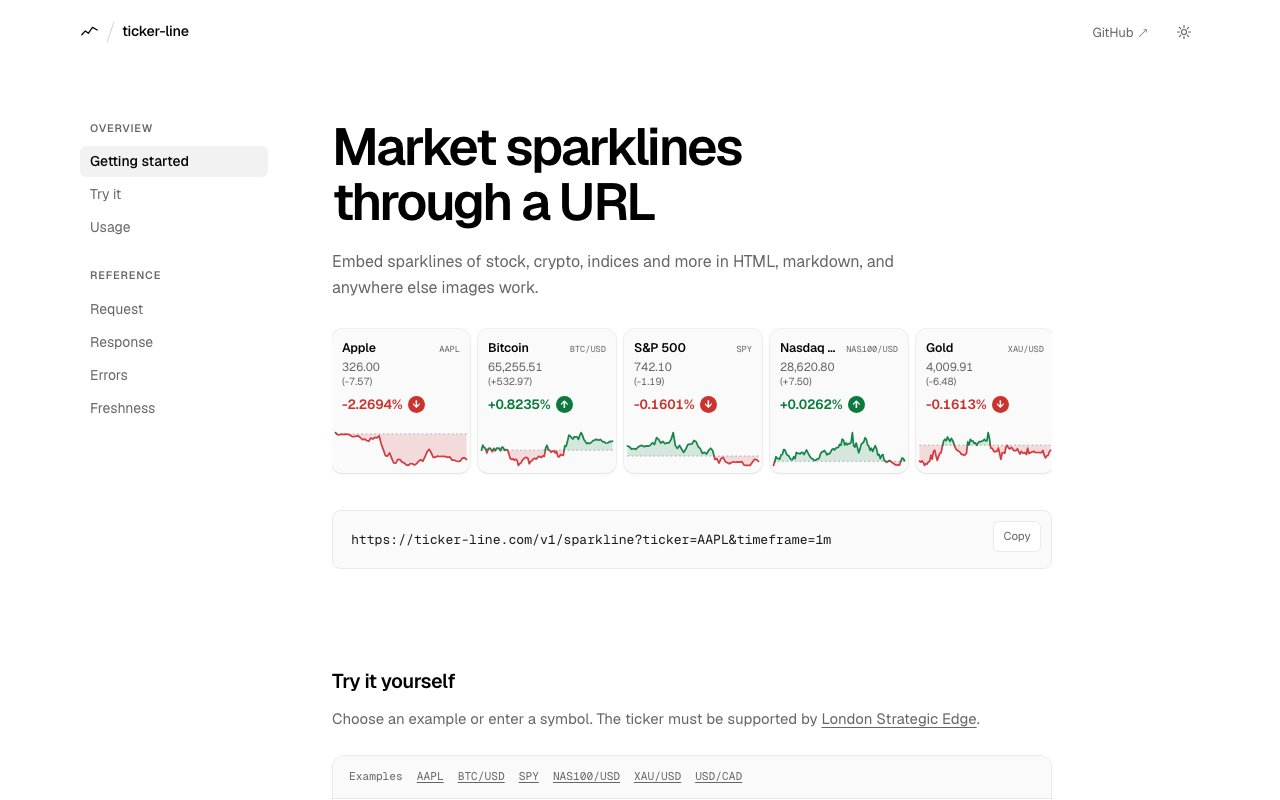
Ticker Line generates embeddable sparkline charts that display price movements for stocks, cryptocurrencies, forex pairs, commodities, and indices. The service works through simple URLs that return SVG images, which means you can drop them into any context that supports images without complex integrations, API libraries, or authentication. Blog posts, documentation pages, GitHub READMEs, Notion documents, email newsletters, and personal websites can all display live market data through what amounts to an image tag with the right source URL. The barrier to adding financial visualizations to your content drops from implementing a charting library to copying a URL.
The technical implementation is elegantly minimal. You construct a URL with parameters specifying the ticker symbol, market type, and desired timeframe, then use that URL as an image source. Timeframe options range from 1 day for intraday movements to 5 years for long term trends, letting you match the visualization to whatever context you're presenting. The returned SVG renders a compact sparkline showing price history, and you can request light or dark themes to match your content's design without any additional styling work. An optional fill visualization adds color shading to distinguish gains from losses at a glance, making the direction of movement immediately obvious even at small sizes.
Beyond the visual output, there's a JSON endpoint that returns structured data including the current price, reference price, percentage change, and direction indicators. This allows developers to combine the sparkline images with programmatic price display, or to build custom interfaces that use the data without rendering their own charts. The dual output format, image for simple embedding and JSON for custom rendering, covers both no code and developer use cases without requiring different integrations. Someone embedding charts in a WordPress post and someone building a React dashboard can both use the same service.
Data freshness varies by timeframe. Shorter ranges like 1 day charts refresh roughly every 25 minutes, while longer ranges update less frequently since historical patterns change slowly. The platform emphasizes that this is intended for visualization and context rather than trading decisions, which makes sense given the refresh intervals and the inherent limitations of sparkline representation. You're getting a sense of direction and volatility, not millisecond accurate tick data. Charts include graceful error handling where failed requests return embeddable fallback images rather than broken image placeholders, so your layouts don't break even when ticker symbols are unavailable, markets are closed, or temporary API issues occur.
The service is completely free with no API key required, though there's fair use rate limiting per IP address to prevent abuse. This makes it accessible for personal projects, blogs, and documentation without signup friction or usage tracking, while the rate limits ensure the service remains available for everyone rather than getting hammered by a few heavy users. For most embedding use cases where you're displaying a handful of charts on a page, the limits shouldn't be noticeable. The no authentication approach means there's nothing to configure, no tokens to manage, and no accounts to create.
The target audience includes technical writers embedding market data in documentation, bloggers covering financial topics, developers building dashboards without wanting to manage data feeds, and anyone who wants to add market context to content without building custom charting infrastructure. Financial newsletters can display ticker performance inline with their analysis. Product documentation for fintech tools can show live examples. Personal investment logs can track positions visually. Educators explaining market concepts can embed real data. The simplicity of the integration means adding a chart takes seconds rather than hours of setup.
What distinguishes Ticker Line from heavyweight charting libraries and paid market data APIs is the zero configuration approach. There's nothing to install, no credentials to manage, no webhooks to configure, and no JavaScript to load. The entire integration is a URL. This does mean you sacrifice customization options that full charting libraries provide, and you're dependent on an external service for image generation. But for cases where you want quick, visually consistent sparklines without operational overhead, it fills the niche effectively. The SVG format ensures charts scale cleanly at any size and remain sharp on high resolution displays, looking good whether embedded in a mobile interface or displayed on a large monitor.
Key Features
- URL-based sparkline generation
- Stocks, crypto, forex, and commodities
- Light and dark theme options
- Configurable timeframes up to 5 years
- JSON endpoint for structured data
- Graceful error handling in SVG output
Pros & Cons
What we like
- No API key or authentication required
- SVG output stays crisp at any display size
- Works anywhere images are supported
- Completely free with fair-use rate limiting
Room for improvement
- Rate limiting kicks in with heavy usage
- Depends on a third-party data provider
- No real-time streaming, just static snapshots
- Minimal customization beyond themes and timeframes
Frequently Asked Questions
What is Ticker Line?
Is Ticker Line free?
What assets does it support?
Can I customize the chart appearance?
Best For
Featured in
Alternatives to Ticker Line
View all


Reviews (7)
Quietly excellent
Have been running Ticker Line for a while, here is where I land. The completely free with fair-use rate limiting is more useful than I expected. It just works, day after day, without surprises. Found it works best for showing quick portfolio snapshots in static sites. Worth it for what I get out of it.
Pulled its weight from week one
Found Ticker Line on a Show HN thread and I am glad I clicked. Got real value out of completely free with fair-use rate limiting. What stands out is how little babysitting it needs. Found it works best for showing quick portfolio snapshots in static sites. Would sign up again without thinking twice.
It just works
Three months of Ticker Line later, here is what holds up. What stands out is how it handles json endpoint for structured data. The interface stays out of my way, which I appreciate. Recommending it to people in a similar spot.
It just works
Ticker Line solves a real problem for me without making a fuss about it. Setup was painless and I was productive the same day. Recommending it to people in a similar spot.
Two months in, no regrets
Ticker Line solves a real problem for me without making a fuss about it. The output quality holds up better than I expected. Hard to imagine going back to my old setup.
Genuinely impressed
Hadn't planned on switching, but Ticker Line was hard to ignore. What stands out is how it handles no api key or authentication required. The core workflow is smooth once you are set up. Easy yes for anyone weighing the same trade offs.
Recommended without reservation
Hadn't planned on switching, but Ticker Line was hard to ignore. Their take on svg output stays crisp at any display size is genuinely good. It slotted into my routine without much fuss. Found it works best for generating charts for documentation or reports. Glad I made the switch.
Badge builder
Add Ticker Line to your website
Choose a badge style and size, preview it here, then copy the generated HTML. Badge images are self-contained SVGs and do not require an external script.

<a href="https://toolindex.net/tools/ticker-line?ref=badge" target="_blank" rel="noopener">
  <img src="https://toolindex.net/badge/ticker-line/medium.svg" alt="Ticker Line - Listed on Tool Index" width="180" height="50" />
</a>How to use the badge
- 1. Pick the style, size, and theme that fit your layout.
- 2. Copy the generated HTML from the code block.
- 3. Paste it into your footer, homepage, or press page.
Standard badge available
The standard listing badge is available now. Score and circle badges are limited to tools currently ranked in the top 10 of a category.
Badge clicks return visitors to this profile with a referral tag so the source remains identifiable.
Related Tools

Simple RMD
Calculate, aggregate, and manage your annual IRA required minimum distributions.
FreshBooks
Cloud accounting designed for service-based small businesses and freelancers
Deel
Global payroll, contractor, and EOR platform
Chargebee
Subscription billing and revenue management for B2B SaaS
Work on Ticker Line? Request listing access or correction