
ForensicDbg
Investigate native Windows crashes visually or through AI tools using MCP
Gallery
About ForensicDbg
ForensicDbg is a modern post-mortem debugger for native Windows software, built to make difficult crashes easier to investigate for both engineers and AI tools. It handles x86 and x64 crash dumps, can attach to running processes, and can become the system's just-in-time debugger so it is available when a failure happens. The product focuses on user-mode debugging and presents process state through a visual interface instead of expecting every user to interpret raw addresses and debugger commands. It is currently offered through a free private beta, with access granted by invitation.
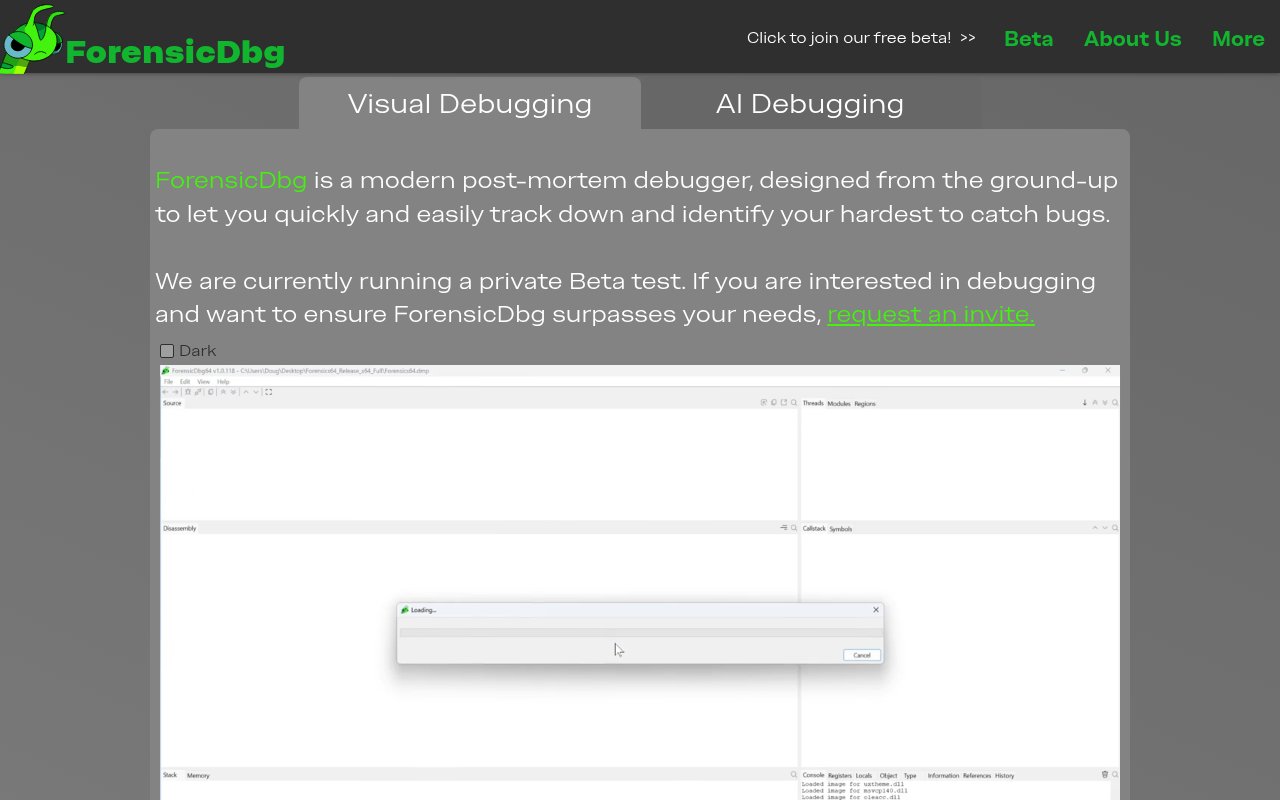
The desktop interface connects the pieces of a crash investigation. Memory regions are labeled with symbol names and object types, objects appear in a structure initialization format, and an address can be clicked to move through the process space. Panels stay synchronized while the user navigates, and color-coded output is designed to make different kinds of data recognizable at a glance. Multi-threaded symbol loading keeps symbol work moving, while SourceServer and SourceLink support help connect compiled state back to source. Light and dark modes follow the system, and a simple C++ expression evaluator supports targeted inspection.
Its deeper value lies in interpreting incomplete or misleading crash evidence. ForensicDbg deduces types from usage and references, tracks register values as they move through disassembly, and validates call stacks so suspicious references don't masquerade as reliable frames. It can simulate the Windows image loader to reconstruct missing read-only regions in minidumps. It also attempts to select the thread, frame, and instruction that caused the exception automatically. These steps encode the sort of cross-checking an experienced native debugger performs before deciding which data deserves attention.
That reconstruction work matters because a minidump may omit read-only process regions that are useful for understanding code and constants. By simulating the loader, ForensicDbg aims to restore enough of that missing context to make navigation and analysis more complete. Type deduction then uses references and observed usage to label data that raw memory alone wouldn't explain clearly. Register tracking connects values with the instructions that move them, while stack validation removes misleading references before they become the foundation for a diagnosis. The result is meant to be a linked account of process state rather than a set of isolated debugger views.
An included MCP server exposes the same debugging engine to compatible AI coding and analysis tools through standard input and output communication. Instead of handing a model an undifferentiated block of hexadecimal data, the server supplies interpreted and labeled debugger output. That lets the external AI spend more of its context on reasoning about the failure and less on recovering basic relationships that the debugger already understands. ForensicDbg itself isn't presented as the AI model. It prepares structured crash evidence and provides the interface through which another tool can inspect it.
The product fits C++ engineers, native Windows teams, reliability specialists, and developers responsible for failures that are hard to reproduce locally. A team can open a customer crash dump for visual investigation, attach the debugger while testing a live process, or register it for just-in-time analysis during development. Teams that already work with an MCP-compatible coding agent can also let that agent query the interpreted state as part of a diagnosis. The visual workflow matters for engineers who want to stay in control, while the MCP path gives automation access to the same labeled process model. The official product example shows the intended level of specificity by tracing a null dereference to an empty text window and identifying where a missing guard should be added.
ForensicDbg is still in active development and the current beta is private, so prospective users must submit their name and email to request an invitation. The beta is free, but the site doesn't publish post-beta pricing or a general release date. Its scope is also intentionally narrow. It targets Windows user-mode crashes on x86 and x64 rather than every platform, architecture, or debugging discipline. Within that boundary, the combination of reconstructed minidump regions, type deduction, validated call stacks, linked visual navigation, and an MCP interface is a substantive toolkit for teams that spend real time tracing native Windows failures.
Key Features
- x86 and x64 crash debugging
- Live process and JIT attachment
- Validated call stack analysis
- Minidump memory reconstruction
- Linked visual process navigation
- MCP server for AI tools
Pros & Cons
What we like
- Interprets memory beyond raw hexadecimal output
- Supports visual and AI-assisted investigations
- Reconnects dumps with source and symbols
- Makes call stack evidence easier to trust
Room for improvement
- Limited to Windows user-mode debugging
- Private beta access requires an invitation
- Supports x86 and x64 architectures only
- Post-beta pricing isn't published
Frequently Asked Questions
What is ForensicDbg?
How does ForensicDbg work with AI tools?
Is ForensicDbg free?
Which crashes can ForensicDbg investigate?
Best For
Featured in
Alternatives to ForensicDbg

Kevin Gabeci
Solo developer building web apps, cozy browser games, and AI creator toolkits.

SoloDevStack
A solo developer blog built on head-to-head tool comparisons, 580+ posts deep.

Codedex
A gamified, story-driven platform that teaches Python, web dev, and more like an RPG quest

Vibe Built
Building real apps with agentic AI. What worked, what broke, what shipped.
Reviews (0)
Badge builder
Add ForensicDbg to your website
Choose a badge style and size, preview it here, then copy the generated HTML. Badge images are self-contained SVGs and do not require an external script.

<a href="https://toolindex.net/tools/forensicdbg?ref=badge" target="_blank" rel="noopener">
  <img src="https://toolindex.net/badge/forensicdbg/medium.svg" alt="ForensicDbg - Listed on Tool Index" width="180" height="50" />
</a>How to use the badge
- 1. Pick the style, size, and theme that fit your layout.
- 2. Copy the generated HTML from the code block.
- 3. Paste it into your footer, homepage, or press page.
Standard badge available
The standard listing badge is available now. Score and circle badges are limited to tools currently ranked in the top 10 of a category.
Badge clicks return visitors to this profile with a referral tag so the source remains identifiable.
Related Tools
Kevin Gabeci
Solo developer building web apps, cozy browser games, and AI creator toolkits.

Coolify
Self-hostable, open source alternative to Heroku and Netlify

Warp
The modern terminal reimagined with AI and collaboration

Bolt.new
Prompt-to-deployed full-stack app inside the browser
Work on ForensicDbg? Request listing access or correction