
GetPageSpeed Amplify
Full web stack monitoring for NGINX, Varnish, PHP-FPM, and MySQL with security analysis
Gallery
About GetPageSpeed Amplify
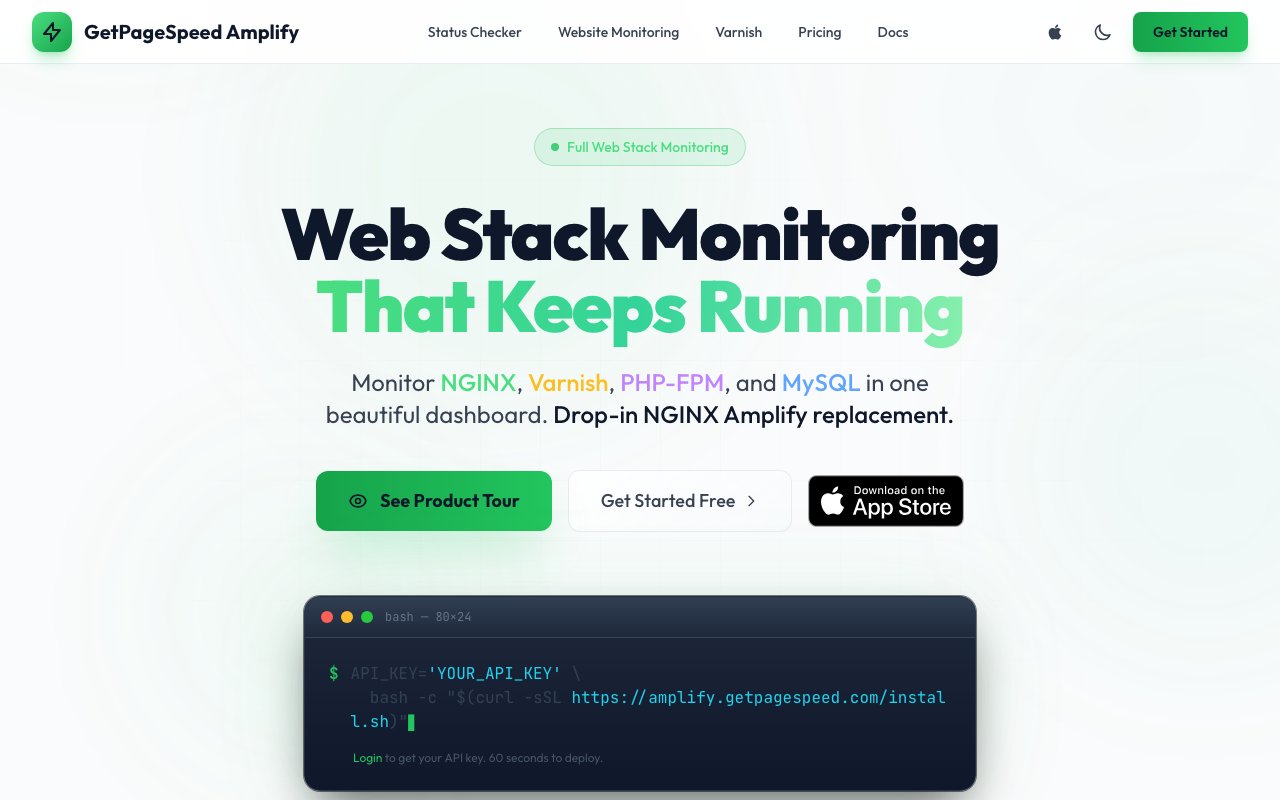
GetPageSpeed Amplify is a monitoring platform built for teams running NGINX, Varnish Cache, PHP-FPM, and MySQL. It collects real-time metrics from each layer of your web stack and presents them in a single dashboard, so you can spot bottlenecks and performance issues without jumping between tools. The product positions itself as a drop-in replacement for NGINX Amplify, which means existing agents work out of the box if you're migrating from the discontinued official service. The nginx-amplify-agent requires zero code modifications to work with the new endpoint, making migration a matter of pointing the agent at a different server rather than rewriting your monitoring setup.
The core problem it addresses is visibility across a stack that often gets monitored in pieces. NGINX handles traffic, Varnish caches responses, PHP-FPM runs application code, and MySQL stores data. Each has its own metrics format and its own monitoring quirks, and correlating a slow response time with the right layer usually means opening four different tools and mentally stitching together timestamps. GetPageSpeed Amplify pulls all of these into one place and lets you correlate them, so a slow response time can be traced back to a database query or a cache miss rather than guesswork. The dashboard calculates a health score across all your servers, giving you a single number to watch before drilling into the specifics.
On the NGINX side, you get connections, requests per second, HTTP errors, response times, and upstream health. The component-specific tabs let you isolate just the NGINX metrics when you're debugging a particular layer. For Varnish, the focus is cache hit ratios, backend health, and object statistics, which tells you whether your caching layer is actually doing its job or just passing requests through. PHP-FPM metrics cover process pools, active workers, and slow request tracking, so you can see when your application code becomes the bottleneck. MySQL tracking includes database performance metrics that surface slow queries before they cascade into user-visible latency. The dashboard updates in real time, and you can set alerts that fire over email or webhook when metrics cross thresholds you define.
Security analysis is bundled in through automatic Gixy scans that find NGINX misconfigurations before attackers do. Gixy is an open-source tool that checks your NGINX configuration for common misconfigurations and vulnerabilities. This runs on initial setup and on subsequent configuration uploads, flagging issues like insecure headers, overly permissive locations, or missing rate limits. It's a lightweight audit rather than a full penetration test, but it catches the low-hanging fruit that often gets overlooked in manual reviews. The platform generates a security score alongside your health score, so you can track improvements over time.
Beyond server metrics, GetPageSpeed Amplify includes website monitoring. You can add URLs and have them checked at intervals ranging from hourly on the free plan to every minute on higher tiers. These checks measure time to first byte, detect HTTP/3 support, analyze Brotli compression, and track SSL certificate expiry so you don't get caught off guard by a lapsed cert. There's also a free website status checker tool that analyzes any site's HTTP protocol, TLS version, compression settings, and timing breakdown, which is useful for auditing sites you don't own.
Agent deployment takes about sixty seconds. You run a curl installation script, claim an API token via GitHub authentication, and your servers appear in the dashboard. The simplicity matters because complex monitoring setups often get abandoned halfway through the installation process, leaving teams without visibility at all. GetPageSpeed Amplify aims to be running and useful within minutes rather than hours.
Pricing starts with a free tier that covers one host, real-time metrics, and security analysis on first configuration upload. Paid plans scale up from there, adding more hosts, longer metric retention, faster website checks, and API access for teams that want to integrate monitoring data into their own tooling. The Starter tier adds five hosts and seven-day retention. Pro supports twenty-five hosts with thirty-day retention and API access. The Team tier covers a hundred hosts with ninety-day retention and security header audits. Enterprise pricing is available for larger deployments.
The target audience is operations teams and solo developers who run their own infrastructure rather than relying on managed platforms. If you're on a VPS or bare metal and you want monitoring without the complexity of Prometheus and Grafana or the cost of Datadog, GetPageSpeed Amplify sits in that middle ground. It's not trying to be a general-purpose observability platform. It's scoped tightly to the LAMP and LEMP stacks that still power a large share of the web, and that narrow focus means the metrics you see are the ones that actually matter for that stack rather than a generic dashboard you have to customize yourself.
Key Features
- Real-time NGINX metrics and upstream health
- Varnish Cache hit ratio analytics
- PHP-FPM and MySQL performance tracking
- Security analysis via Gixy integration
- Website monitoring with SSL expiry alerts
- Configurable alerts over email and webhook
Pros & Cons
What we like
- Drop-in replacement for NGINX Amplify with existing agent compatibility
- Unified dashboard for the entire web stack
- Built-in security configuration scanning
- Generous free tier for single-host setups
Room for improvement
- Focused on NGINX stacks, not general-purpose observability
- Free tier limited to four hours of metric retention
- No APM-level code tracing or distributed tracing
- Security analysis is static config review, not runtime protection
Frequently Asked Questions
What is GetPageSpeed Amplify?
Is GetPageSpeed Amplify free?
Can I migrate from NGINX Amplify?
What kind of security analysis does it include?
Best For
Featured in
Alternatives to GetPageSpeed Amplify
Notionlytics
Page-view analytics and reader feedback widgets for public Notion pages

Cometly
Marketing attribution for B2B SaaS that ties ad spend to pipeline and closed-won revenue

Amplitude
Digital analytics platform for product, growth, and marketing teams to analyze user behavior across web and mobile.

Simple Analytics
Cookieless, GDPR-friendly web analytics that needs no consent banner
Reviews (0)
No reviews yet
Be the first to share your experience with GetPageSpeed Amplify
Sign in to write a reviewBadge builder
Add GetPageSpeed Amplify to your website
Choose a badge style and size, preview it here, then copy the generated HTML. Badge images are self-contained SVGs and do not require an external script.

<a href="https://toolindex.net/tools/getpagespeed-amplify?ref=badge" target="_blank" rel="noopener">
  <img src="https://toolindex.net/badge/getpagespeed-amplify/medium.svg" alt="GetPageSpeed Amplify - Listed on Tool Index" width="180" height="50" />
</a>How to use the badge
- 1. Pick the style, size, and theme that fit your layout.
- 2. Copy the generated HTML from the code block.
- 3. Paste it into your footer, homepage, or press page.
Standard badge available
The standard listing badge is available now. Score and circle badges are limited to tools currently ranked in the top 10 of a category.
Badge clicks return visitors to this profile with a referral tag so the source remains identifiable.
Related Tools

Sleep Suivour
Track your sleep, improve your rest
Notionlytics
Page-view analytics and reader feedback widgets for public Notion pages
Mixpanel
Product analytics tool for tracking user events, funnels, retention, and cohorts to understand how people use your app.

Simple Analytics
Privacy-friendly web analytics with a clean dashboard, event tracking, and a strong stance against personal data collection.
Work on GetPageSpeed Amplify? Request listing access or correction