NativeScope
Open-source local debugging studio for React Native with storage, network, and log inspection
Gallery
About NativeScope
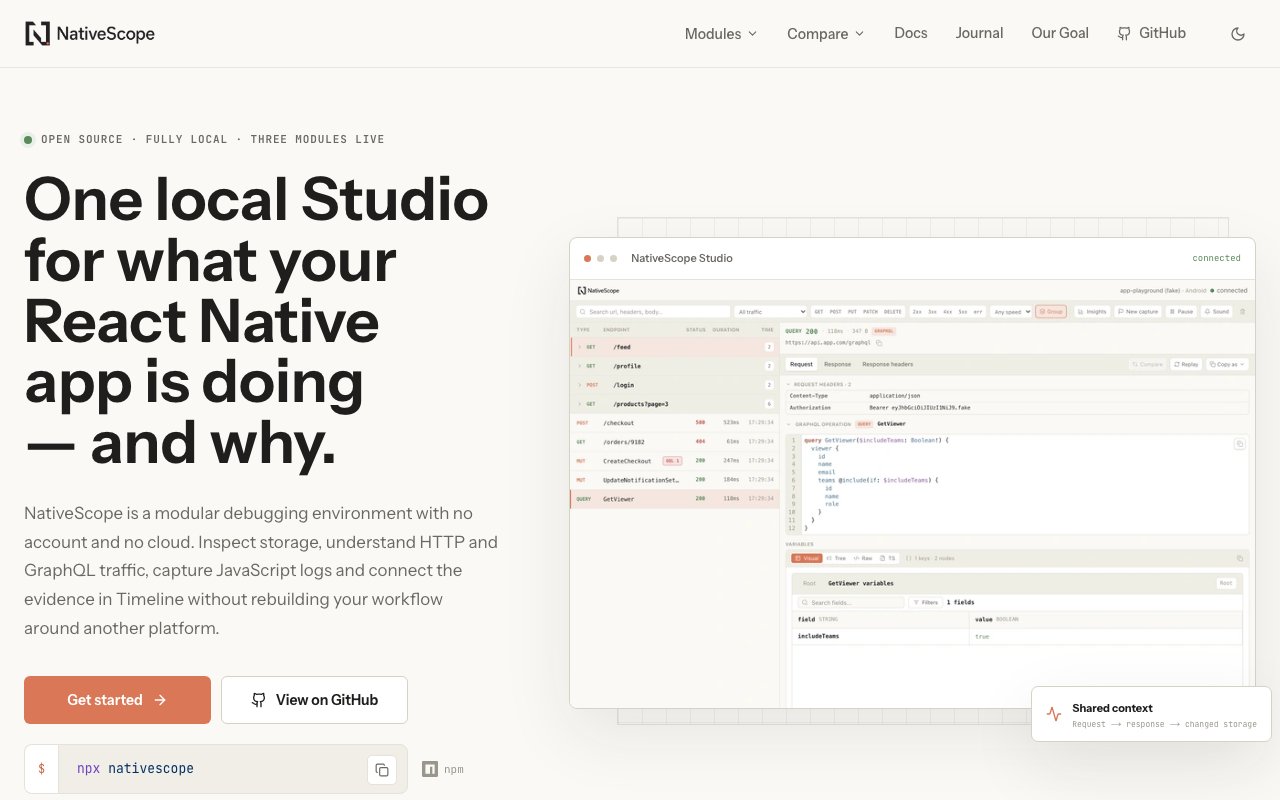
NativeScope is a local debugging environment built specifically for React Native applications, addressing a persistent pain point in mobile development where debugging tools are often fragmented across multiple applications and contexts. The tool runs entirely on the developer's machine with no cloud dependencies, account requirements, or external data transmission. When developers encounter issues in their React Native apps, they typically need to piece together separate tools for storage inspection, network monitoring, and console log analysis, then mentally correlate events across these disconnected interfaces. NativeScope unifies these debugging domains into a single application called NativeScope Studio, connecting insights across storage, network activity, and console output through a shared timeline that shows exactly how events relate to each other in sequence.
Storage debugging covers the three most common persistence solutions used in React Native applications today. Developers can inspect AsyncStorage, MMKV, and SQLite databases live while the app runs, seeing exactly what data exists at any moment and how it changes over time in response to user actions or background processes. The interface provides visual JSON navigation that makes complex nested data structures readable and navigable, expanding and collapsing nodes to focus on relevant information without losing context. Inline editing allows developers to modify values directly within the debugging interface without writing code, rebuilding the app, or using separate database tools. This capability proves particularly useful for testing how the app handles different data states or for resetting problematic values during development. Snapshot comparison shows differences between storage states at different points in time, making it easier to understand exactly what changed and when during a session.
Network monitoring captures HTTP and GraphQL traffic with structured replay capabilities that go beyond simple request and response logging. Rather than showing raw network data that requires manual parsing, the tool understands GraphQL operations and presents them in an operation-aware timeline. Developers can see queries, mutations, and their variables in a structured format that matches how they think about their API layer. Replay functionality allows developers to re-execute network requests to test how their app handles different server responses, which proves particularly useful for debugging edge cases, error states, and timeout scenarios without requiring a specialized test server setup or network mocking. The network timeline integrates with the broader debugging interface, connecting requests to the console logs and storage changes that happen as a result of network activity completing.
Console log capture starts recording from application startup, ensuring developers never miss the early initialization messages that can be crucial for debugging launch issues, configuration problems, or race conditions during app boot. Many debugging approaches only capture logs after the developer explicitly opens the debugging interface, missing exactly the messages needed to diagnose startup failures. The log viewer provides search functionality across the complete log history and displays structured values in a readable, expandable format rather than collapsed JSON strings that require copying and pasting into separate formatting tools. Logs connect to the shared timeline alongside network requests and storage operations, giving developers a complete picture of what happened, in what order, and how different systems interacted during any problematic sequence.
Setup requires installing a single npm package and configuring one TypeScript file that declares which debugging modules to enable for the application. This minimal setup friction means developers can add NativeScope to existing projects without significant restructuring, refactoring, or adopting new architectural patterns. The configuration approach lets teams enable only the modules they need, keeping the debugging surface focused on relevant systems. The instrumentation that enables debugging automatically strips from release builds through Metro bundler integration, so there's no concern about debug code shipping to production users or affecting app store compliance. This build-time removal happens without manual intervention or separate build configurations.
The tool is completely free and open source, removing any barrier to adoption for individual developers or teams evaluating debugging tools. React Native developers who need production-like debugging capabilities without adopting external platforms, creating accounts, or sending data to third-party services will find the local-first approach particularly fitting. The emphasis on preserved context across debugging domains means developers spend less time mentally correlating events from separate tools and more time understanding actual application behavior. For teams that handle sensitive data or operate under corporate policies restricting external service usage, the fully local operation provides a compliant debugging solution that doesn't require security review or data handling agreements with external vendors.
Key Features
- AsyncStorage, MMKV, and SQLite inspection
- HTTP and GraphQL traffic capture
- JavaScript console log recording from boot
- Unified timeline across all modules
- Snapshot comparison and state restore
- Dev-only instrumentation stripped from production
Pros & Cons
What we like
- Runs entirely offline with no account or cloud dependency
- Ties storage, network, and logs into a single timeline
- Zero-config setup via npx with one TypeScript file
- Open source and free with no paid tier
Room for improvement
- Focused on React Native, not other mobile frameworks
- Requires Metro build system for automatic stripping
- Smaller community than established tools like Flipper
- Modular design means you still configure which pieces to enable
Frequently Asked Questions
What is NativeScope?
Is NativeScope free?
Does NativeScope require an internet connection?
Will NativeScope code ship in my production app?
Best For
Featured in
Alternatives to NativeScope

Kevin Gabeci
Solo developer building web apps, cozy browser games, and AI creator toolkits.

SoloDevStack
A solo developer blog built on head-to-head tool comparisons, 580+ posts deep.

Codedex
A gamified, story-driven platform that teaches Python, web dev, and more like an RPG quest
Vibe Built
Building real apps with agentic AI. What worked, what broke, what shipped.
Reviews (0)
Badge builder
Add NativeScope to your website
Choose a badge style and size, preview it here, then copy the generated HTML. Badge images are self-contained SVGs and do not require an external script.

<a href="https://toolindex.net/tools/nativescope?ref=badge" target="_blank" rel="noopener">
  <img src="https://toolindex.net/badge/nativescope/medium.svg" alt="NativeScope - Listed on Tool Index" width="180" height="50" />
</a>How to use the badge
- 1. Pick the style, size, and theme that fit your layout.
- 2. Copy the generated HTML from the code block.
- 3. Paste it into your footer, homepage, or press page.
Standard badge available
The standard listing badge is available now. Score and circle badges are limited to tools currently ranked in the top 10 of a category.
Badge clicks return visitors to this profile with a referral tag so the source remains identifiable.
Related Tools
Kevin Gabeci
Solo developer building web apps, cozy browser games, and AI creator toolkits.

Coolify
Self-hostable, open source alternative to Heroku and Netlify

Warp
The modern terminal reimagined with AI and collaboration

Bolt.new
Prompt-to-deployed full-stack app inside the browser
Work on NativeScope? Request listing access or correction