
PeachTrace
Self-hosted observability platform for metrics, logs, and traces built on OpenTelemetry
Gallery
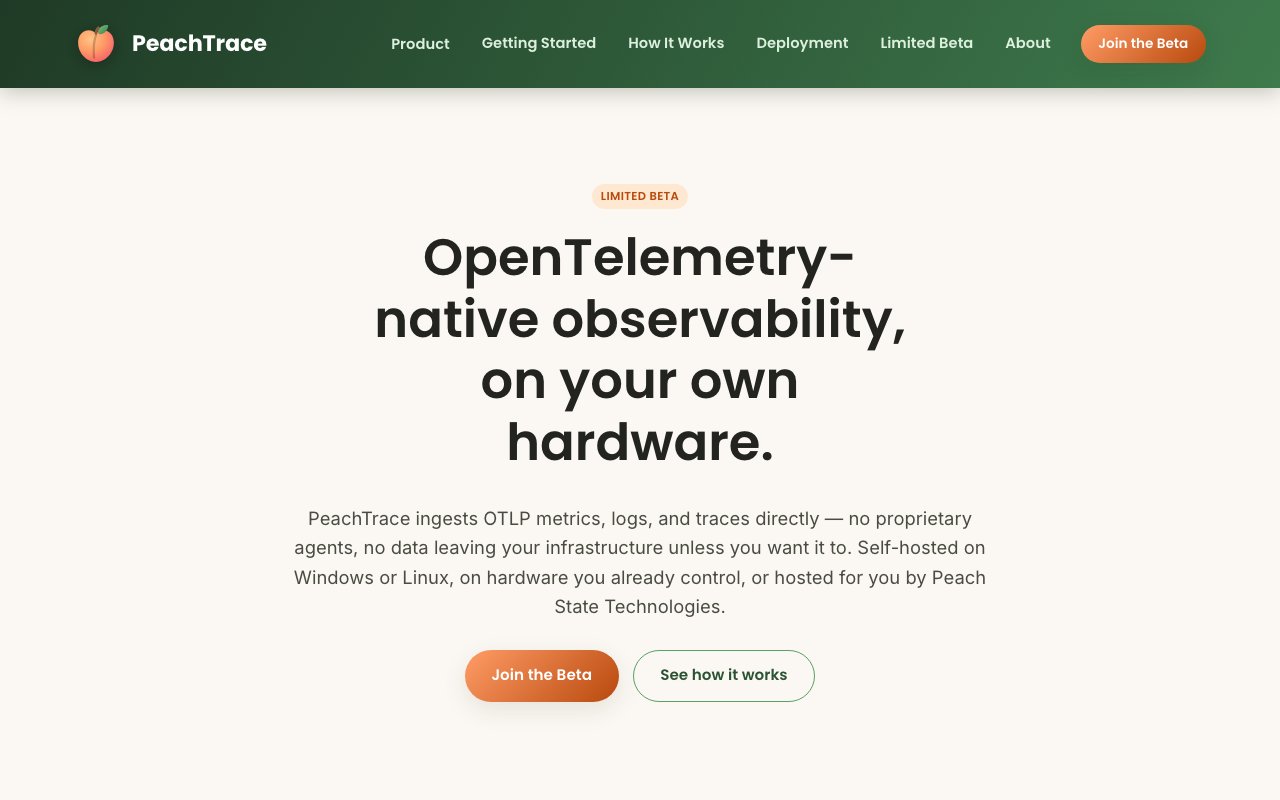
About PeachTrace
PeachTrace is a self-hosted observability platform that ingests metrics, logs, and traces through the OpenTelemetry Protocol and stores them in a unified database you control. It is built for teams that want the correlation benefits of a modern observability stack without sending data to a third-party cloud or paying per-gigabyte ingestion fees that scale unpredictably as traffic grows. The platform runs on Windows or Linux servers, so you can deploy it on your own infrastructure or use managed hosting through Peach State Technologies if you want the data sovereignty benefits without running the instance yourself.
The core premise is that all three signal types belong together. A spike in a metric should link directly to the traces that caused it, and those traces should link to the log lines emitted during execution. PeachTrace preserves trace_id and span_id across all three signals, so you can click from an anomaly in a chart straight through to the specific request and its logs without switching tools, running separate queries, or reconciling timestamps manually. That correlation is built into the data model rather than bolted on after the fact, which makes incident triage faster because you spend less time hunting across systems for the context you need.
On the metrics side, PeachTrace supports ad-hoc queries with percentile estimation and time-bucketed aggregation. You can slice data by service, tag, or custom dimensions without pre-defining rollups. Logs are searchable in real time and carry the correlation IDs needed to jump into traces with one click. The search is full-fidelity, meaning you are querying the actual OTel log records rather than a sampled or truncated subset. Traces render as waterfall visualizations that show the full path of a request across services, with latency broken down by span. Error markers highlight where exceptions occurred, so you can spot the failing service without reading through the entire trace.
Beyond the three core signals, PeachTrace extracts additional insights automatically. Slow-query analysis surfaces database calls and external requests that exceed latency thresholds, derived directly from trace spans without requiring separate instrumentation. Exception grouping clusters errors by service, type, and call site, then deduplicates so you see one entry per unique error pattern rather than thousands of repetitions. These features reduce the manual work of sifting through raw telemetry and point you toward the actual problems faster.
Integration is standard OpenTelemetry. If your services already export OTLP over gRPC or HTTP, you point the exporter at your PeachTrace instance and the data flows in. There is no proprietary agent to install, no SDK to swap in, and no vendor-specific configuration to maintain. That keeps lock-in low and makes it straightforward to switch in or out of the stack later. If you are already using the OTel Collector, you add PeachTrace as an exporter alongside whatever backends you already have.
An API-first design means everything you can do in the dashboard is also available through a public REST API. That lets you build custom alerts, pull data into external tools, automate incident workflows, or power internal dashboards without depending on the web interface. If you have a runbook that queries observability data as part of an automated response, the API gives you programmatic access to the same views the dashboard uses.
The target audience is engineering teams that want full ownership of their telemetry. That includes organizations in regulated industries with strict data residency requirements, teams that have outgrown the free tiers of SaaS observability tools and are facing steep ingestion bills, and platform engineering groups building internal developer tooling around observability data. If your current vendor charges by the gigabyte and your traffic is growing, PeachTrace offers an alternative where you pay for your own compute and storage rather than a metered fee tied to volume.
Pricing is not published on the site because the product is currently in limited beta. You can sign up for access through Peach State Technologies and discuss terms from there. The self-hosted model typically means your costs are infrastructure rather than software licensing, though the managed hosting option would carry its own pricing. Because the beta is still ongoing, documentation and support are still maturing, and the community is smaller than established vendors. Teams evaluating PeachTrace should factor in that they are adopting a younger product with less ecosystem support in exchange for cost control and data ownership.
Key Features
- Unified storage for metrics, logs, and traces
- OTLP ingestion over gRPC and HTTP
- Trace waterfall visualization
- Real-time log search with trace correlation
- Slow-query analysis from trace data
- Public REST API for all dashboard functions
Pros & Cons
What we like
- Data stays on your infrastructure with no third-party cloud
- No per-gigabyte ingestion fees for self-hosted deployments
- Correlation IDs link metrics, logs, and traces natively
- Standard OpenTelemetry integration, no proprietary agents
Room for improvement
- Currently in limited beta with no published pricing
- Self-hosted deployments require your own infrastructure
- Smaller community and ecosystem than established vendors
- Documentation and support are still maturing
Frequently Asked Questions
What is PeachTrace?
Is PeachTrace free?
Who is PeachTrace for?
How do I send data to PeachTrace?
Best For
Featured in
Alternatives to PeachTrace
Notionlytics
Page-view analytics and reader feedback widgets for public Notion pages

Cometly
Marketing attribution for B2B SaaS that ties ad spend to pipeline and closed-won revenue

Amplitude
Digital analytics platform for product, growth, and marketing teams to analyze user behavior across web and mobile.

Simple Analytics
Cookieless, GDPR-friendly web analytics that needs no consent banner
Reviews (0)
Badge builder
Add PeachTrace to your website
Choose a badge style and size, preview it here, then copy the generated HTML. Badge images are self-contained SVGs and do not require an external script.

<a href="https://toolindex.net/tools/peachtrace?ref=badge" target="_blank" rel="noopener">
  <img src="https://toolindex.net/badge/peachtrace/medium.svg" alt="PeachTrace - Listed on Tool Index" width="180" height="50" />
</a>How to use the badge
- 1. Pick the style, size, and theme that fit your layout.
- 2. Copy the generated HTML from the code block.
- 3. Paste it into your footer, homepage, or press page.
Standard badge available
The standard listing badge is available now. Score and circle badges are limited to tools currently ranked in the top 10 of a category.
Badge clicks return visitors to this profile with a referral tag so the source remains identifiable.
Related Tools

Sleep Suivour
Track your sleep, improve your rest
Notionlytics
Page-view analytics and reader feedback widgets for public Notion pages
Mixpanel
Product analytics tool for tracking user events, funnels, retention, and cohorts to understand how people use your app.

Simple Analytics
Privacy-friendly web analytics with a clean dashboard, event tracking, and a strong stance against personal data collection.
Work on PeachTrace? Request listing access or correction