Plexus
Hardware observability for monitoring devices, telemetry, and fleets
Gallery
About Plexus
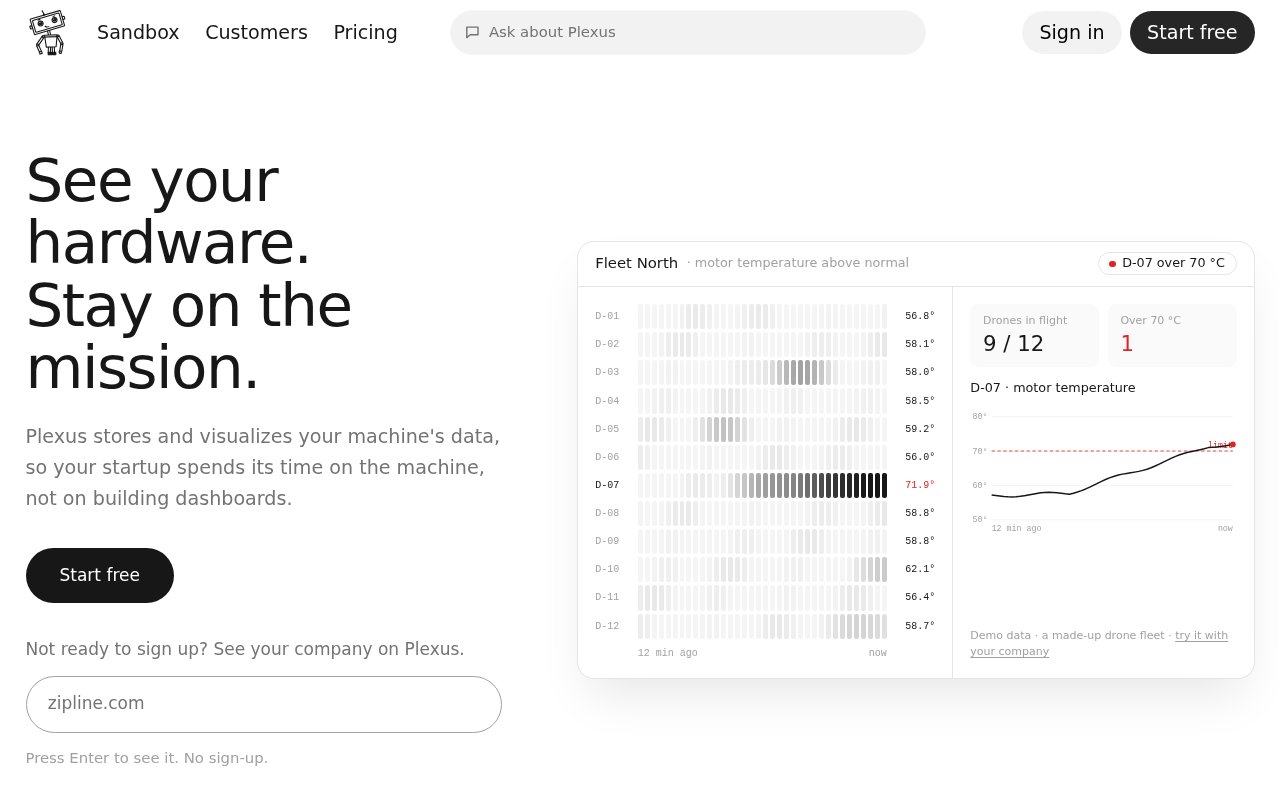
Plexus is a hardware observability platform for teams that need to understand what physical devices are doing in development, testing, and production. It gives engineers one place to ingest telemetry, inspect historical measurements, watch a fleet in real time, and build the operational screens that colleagues or customers use. The problem it addresses is common at hardware companies. A capable engineering team can build its own databases, dashboards, alerts, and customer portals, but that work competes directly with improving the machine. Plexus supplies that operational layer so the team can spend less time assembling internal telemetry software.
Data can enter through the Python SDK, plain HTTP, Prometheus remote write, and documented hardware patterns for boards such as ESP32 and Arduino. Plexus organizes each device or process as a source, then associates numeric time series metrics, structured events, commands, and video with that identity. Teams can query stored history, stream live values, aggregate readings across a fleet, and use the built in dashboards to see which unit needs attention. Threshold, event, and offline alerts can reach operators through email, Slack, or webhooks. A REST and WebSocket Data API is available when a team wants to build its own interface or move data into another workflow. The quickstart says a developer can send and read back a first metric in under five minutes, giving a technical team a concrete way to test the data path before committing a fleet.
Plexus doesn't require every customer to move existing telemetry into its own store. Its connection model can read data where it already lives, using read access rather than writing back to the connected system. The current integration catalog marks PostgreSQL, TimescaleDB, ClickHouse, QuestDB, MySQL, Prometheus, PX4 flight logs, YAMCS, and COSMOS as available connections, while InfluxDB is listed as partial. Those external sources can appear beside devices on the same dashboards. Alerting has an important boundary here. The docs say alerts evaluate telemetry stored by Plexus, so data queried on demand from a ground system connection can be charted and browsed but can't currently drive alert rules.
The product fits small and growing teams operating robots, spacecraft, industrial equipment, medical devices, connected infrastructure, or other sensor rich systems. It is useful from early bench testing through field operations because the same basic model covers an individual prototype and a fleet of sources. Engineers can compare revisions, examine faults, track uptime, and share evidence that a hardware change improved reliability. Teams can also describe a chart in plain language and build it over their real telemetry, then share a link or embed a panel in a product or customer portal. That doesn't remove the need to understand the signals, but it reduces the amount of query and frontend work needed to present them.
What distinguishes Plexus is its narrow focus on physical systems and its willingness to fit around an existing stack. It combines device ingestion, fleet views, stored history, external data connections, dashboards, alerts, and an API without treating the telemetry database as the only product. The company also offers a managed deployment in which a Plexus engineer helps land the stack, create dashboards and schemas, and hand the result back to the customer. For controlled environments, the same platform can run in a customer's cloud or on the customer's own hardware. The site says self-hosted deployments make no outbound calls except optional integrations configured by the customer, which makes air-gapped operation a stated target rather than an improvised workaround.
Pricing needs a careful read because the current site presents two entry messages. The homepage advertises a free plan for three devices with seven days of history, plus a Founding 50 plan at $299 per month. The dedicated pricing page instead says Plexus Cloud is usage priced from the first data point, with separate rates for metric rows, log or event rows, and video hours, and no device cap. Enterprise managed deployment and self-hosting use custom contracts, with support, service terms, audit capabilities, and deployment help shaped around the fleet. A team evaluating Plexus should confirm which entry offer applies to its account, then estimate data volume as well as device count. The product is easy to try from the hosted app, but its strongest value appears when telemetry, operations, and customer facing views need to stay connected as a fleet grows.
Key Features
- Real time fleet monitoring
- Historical telemetry queries
- Built in dashboards and alerts
- Existing data source connections
- REST and WebSocket APIs
- Cloud or self-hosted deployment
Pros & Cons
What we like
- Keeps device telemetry and fleet status in one operational view
- Reads supported external stores without moving their data first
- Supports hosted, customer cloud, and air-gapped deployments
- Provides APIs and embeddable panels for custom product experiences
Room for improvement
- Homepage and pricing page describe different entry offers
- Alerts require telemetry stored inside Plexus
- Several listed integrations aren't available yet
- Managed deployment and self-hosting require a custom contract
Frequently Asked Questions
What is Plexus?
Does Plexus require moving existing telemetry?
Can Plexus run in an air-gapped environment?
Is Plexus free?
Best For
Featured in
Alternatives to Plexus
Notionlytics
Page-view analytics and reader feedback widgets for public Notion pages

Cometly
Marketing attribution for B2B SaaS that ties ad spend to pipeline and closed-won revenue

Amplitude
Digital analytics platform for product, growth, and marketing teams to analyze user behavior across web and mobile.

Simple Analytics
Cookieless, GDPR-friendly web analytics that needs no consent banner
Reviews (0)
Badge builder
Add Plexus to your website
Choose a badge style and size, preview it here, then copy the generated HTML. Badge images are self-contained SVGs and do not require an external script.

<a href="https://toolindex.net/tools/plexus?ref=badge" target="_blank" rel="noopener">
  <img src="https://toolindex.net/badge/plexus/medium.svg" alt="Plexus - Listed on Tool Index" width="180" height="50" />
</a>How to use the badge
- 1. Pick the style, size, and theme that fit your layout.
- 2. Copy the generated HTML from the code block.
- 3. Paste it into your footer, homepage, or press page.
Standard badge available
The standard listing badge is available now. Score and circle badges are limited to tools currently ranked in the top 10 of a category.
Badge clicks return visitors to this profile with a referral tag so the source remains identifiable.
Related Tools

Sleep Suivour
Track your sleep, improve your rest
Notionlytics
Page-view analytics and reader feedback widgets for public Notion pages
Mixpanel
Product analytics tool for tracking user events, funnels, retention, and cohorts to understand how people use your app.

Simple Analytics
Privacy-friendly web analytics with a clean dashboard, event tracking, and a strong stance against personal data collection.
Work on Plexus? Request listing access or correction