
SubTrends
Free subreddit analytics covering 100,000+ communities with 18 years of posting history
Gallery
About SubTrends
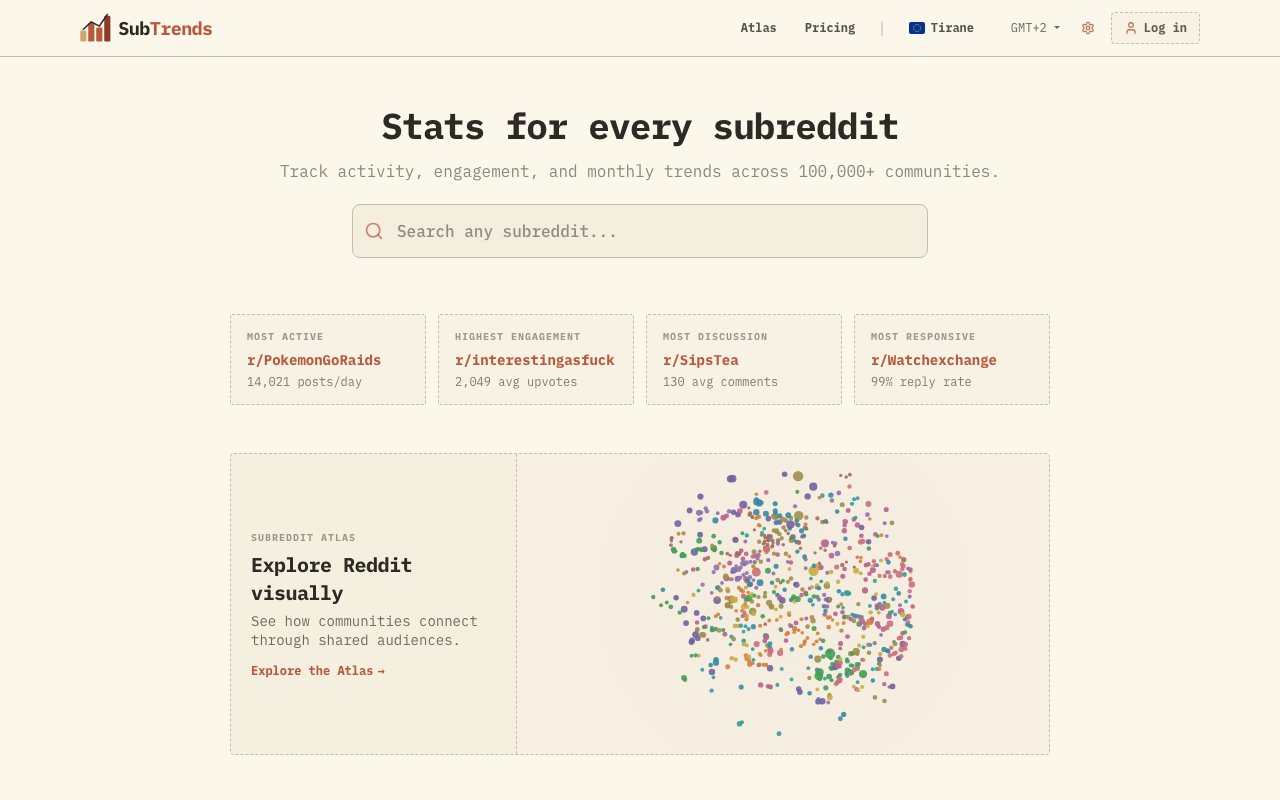
SubTrends is a subreddit analytics tool that tracks posting activity, engagement metrics, and timing patterns across more than 100,000 Reddit communities. If you want to understand how a subreddit behaves, when posts get traction, or how a community has changed over time, this is the data source. The free tier gives you a current snapshot of any subreddit without requiring a login or account creation. The Pro tier unlocks the full historical archive going back 18 years, covering the entire lifespan of Reddit's community ecosystem from 2008 to today. That kind of historical depth is rare in any analytics space, let alone Reddit specifically.
Reddit analytics tools have had a rough few years. When Reddit announced paid API access in 2023, it killed most of the free data collectors that developers and marketers had relied on. Some paid tools shut down entirely because the economics no longer worked. Others tried to pivot but couldn't maintain their historical datasets and had to start fresh. SubTrends survives by working with publicly available post data rather than relying on real time API access that Reddit now charges for. All figures are computed from actual post level data, not estimates or samples, which makes the metrics more reliable than tools that extrapolate from smaller datasets or proxy signals like subscriber counts.
The core use case is understanding subreddit dynamics before you engage with a community. Marketers use it to find the best times to post, identifying the windows when their content is most likely to gain visibility before getting buried by newer submissions. Community managers use it to track whether engagement is growing or declining, spotting trends before they become obvious to casual observers. Academic researchers use it to study how online communities evolve over years, with enough historical depth to see multi year patterns that shorter datasets would miss entirely. The data covers monthly activity, engagement rates, and timing statistics that show when posts typically perform best in each specific community.
The free version requires no login and no account creation. You can look up any subreddit and get current stats including recent posting volume, engagement patterns, and optimal posting windows. This is enough if you just need a quick read on a community before participating or pitching it to a client. You can see how active a subreddit is right now, what kind of engagement it generates, and when activity tends to peak during the day and week. For casual use or one off research, the free tier covers it without any signup friction.
Pro adds full historical charts that can display data at any range from three months to the complete 18 year archive. You can see how a subreddit grew from a few hundred subscribers to millions, when it peaked, when it declined, and how it compares to similar communities over time. This kind of longitudinal data is rare in the Reddit analytics space, especially after the 2023 API changes forced many competitors offline. CSV export is available for any month, which is useful if you want to run your own analysis in a spreadsheet, feed the data into visualization tools, or combine it with other datasets. The complete rankings across all 100,000 plus communities let you discover niche subreddits that might not show up in surface level searches or standard Reddit discovery flows.
New data typically appears within a few weeks of each month closing, sometimes taking up to a month depending on processing volume. This is not real time monitoring. It is monthly retrospective analysis designed for strategic planning rather than day to day posting decisions. If you need live tracking of comments and upvotes as they happen, this is not the tool for that. But for understanding longer term patterns and historical trends, the depth of data is hard to match elsewhere. The fact that it still exists and continues to update while so many Reddit analytics tools have shut down says something about the sustainability of the approach.
Pricing follows a straightforward model with a free tier and a Pro subscription. The exact Pro cost is not prominently displayed on the landing page, but the site describes it as simple pricing that lets you cancel anytime without penalty. Your bookmarks and saved subreddits persist even if you cancel, and you keep access through the end of your billing period. This is a tool built for analysts, marketers, content creators, and community researchers who need Reddit data without the overhead of building and maintaining their own data pipeline. If you've been burned by other Reddit tools disappearing after the API changes, SubTrends offers a stable alternative with a track record of staying online through the transition that killed its competitors.
Key Features
- Analytics for 100,000+ subreddit communities
- 18 years of historical posting data
- Monthly activity and engagement metrics
- Best posting time recommendations
- CSV export for external analysis
- No login required for basic access
Pros & Cons
What we like
- Works with public post data, not deprecated API endpoints
- Free tier gives useful snapshots without signup
- Historical depth back to 2008 is rare in this space
- Data is computed from actual posts, not estimates
Room for improvement
- Monthly updates, not real time tracking
- Pro pricing not prominently displayed upfront
- Focused on subreddit level, not individual user analytics
- Some niche subreddits may have sparse historical data
Frequently Asked Questions
What is SubTrends?
Is SubTrends free?
How current is the data?
Why do other Reddit analytics tools keep shutting down?
Best For
Featured in
Alternatives to SubTrends
Notionlytics
Page-view analytics and reader feedback widgets for public Notion pages

Cometly
Marketing attribution for B2B SaaS that ties ad spend to pipeline and closed-won revenue

Amplitude
Digital analytics platform for product, growth, and marketing teams to analyze user behavior across web and mobile.

Simple Analytics
Cookieless, GDPR-friendly web analytics that needs no consent banner
Reviews (0)
Badge builder
Add SubTrends to your website
Choose a badge style and size, preview it here, then copy the generated HTML. Badge images are self-contained SVGs and do not require an external script.

<a href="https://toolindex.net/tools/subtrends?ref=badge" target="_blank" rel="noopener">
  <img src="https://toolindex.net/badge/subtrends/medium.svg" alt="SubTrends - Listed on Tool Index" width="180" height="50" />
</a>How to use the badge
- 1. Pick the style, size, and theme that fit your layout.
- 2. Copy the generated HTML from the code block.
- 3. Paste it into your footer, homepage, or press page.
Standard badge available
The standard listing badge is available now. Score and circle badges are limited to tools currently ranked in the top 10 of a category.
Badge clicks return visitors to this profile with a referral tag so the source remains identifiable.
Related Tools

Sleep Suivour
Track your sleep, improve your rest
Notionlytics
Page-view analytics and reader feedback widgets for public Notion pages
Mixpanel
Product analytics tool for tracking user events, funnels, retention, and cohorts to understand how people use your app.

Simple Analytics
Privacy-friendly web analytics with a clean dashboard, event tracking, and a strong stance against personal data collection.
Work on SubTrends? Request listing access or correction