
telemetry.dev
OpenTelemetry-native tracing and cost tracking for LLM apps and agents, with a free tier
Gallery
About telemetry.dev
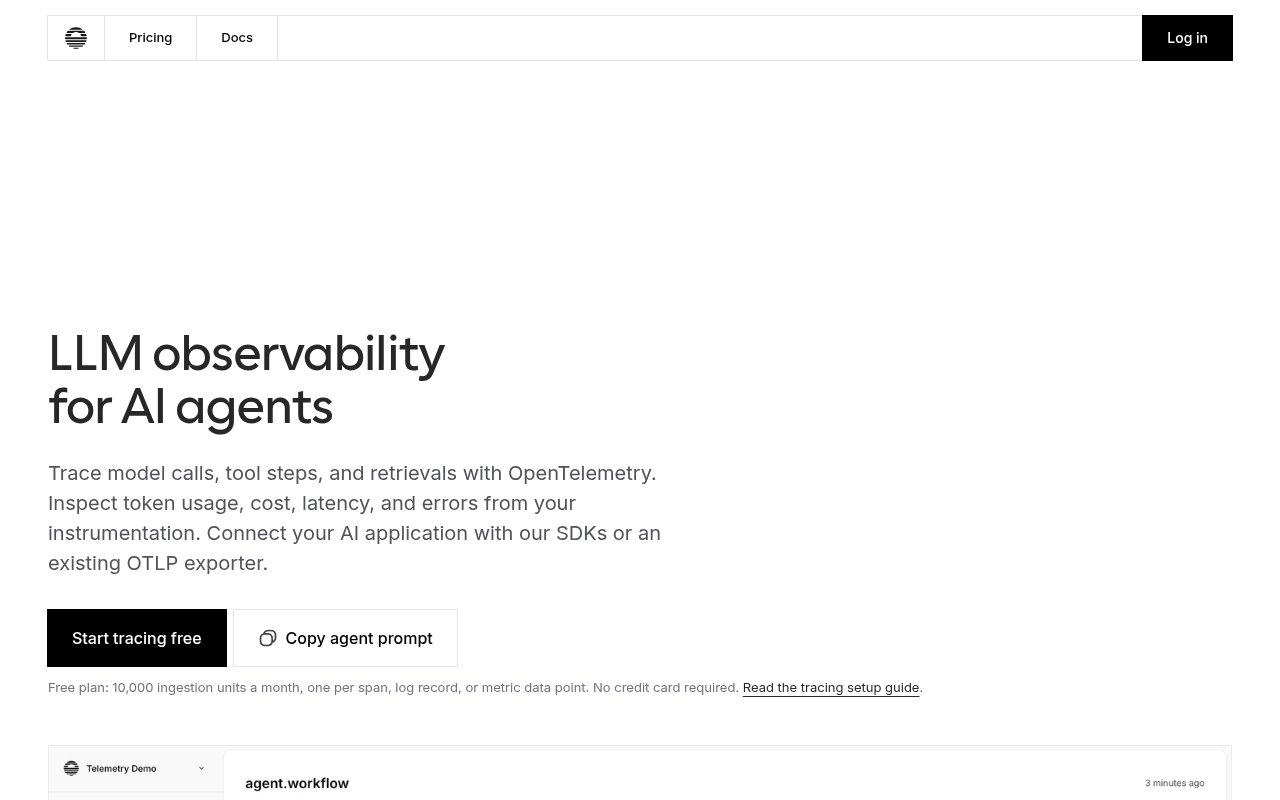
telemetry.dev is an observability platform for applications built on large language models and agents. It traces each request across the model calls, tool steps and retrievals inside it, records token usage, cost, latency and errors along the way, and gives you dashboards and search to work out what happened when something goes wrong or gets expensive. It's built on OpenTelemetry from the ground up rather than on a proprietary agent. Search covers the attributes you'd expect, and the dashboards are built around cost, errors and latency percentiles rather than generic host metrics.
The problem it addresses is that LLM apps fail in ways ordinary APM tools don't see. A request can succeed with a 200 and still have called the wrong tool, looped three times, or burned twenty times the expected tokens. Generic tracing shows you spans without meaning, and vendor-specific LLM tools lock you into their SDK. telemetry.dev tries to sit in the middle, understanding the shape of an agent run while speaking the standard everyone else already uses. The cost side is the same story. A bill arrives at the end of the month, and without per-request token accounting there's no way to tell which feature, environment or customer produced it.
Getting data in works three ways. There are drop-in SDKs for TypeScript and Python, pre-built integrations for frameworks and providers including LangChain, the Vercel AI SDK, OpenAI, Anthropic and Google Gemini, and plain OTLP over HTTP for any language that already has an OpenTelemetry exporter. Capture is on by default, and you can turn off storage of prompts and completions per environment when a production system shouldn't keep them. Costs are computed from token counts against a model pricing catalogue, so the dollar figures show up without you maintaining a rate table. Sessions group related requests, so an agent conversation that spans many calls can be followed as one thread rather than a pile of unrelated traces.
Once traces land you can search and filter by name, status, environment, framework or session, follow a session through its steps, and watch dashboards for cost trends, error rates and p95 latency. The unit of billing is simple. One normalized span, one OTLP log record or one metric data point is one ingestion unit, so a trace with five spans costs five units, while logs attached as span events and metric updates to an existing span don't cost extra. Retention is where the plans differ most, from seven days on Free to ninety on Team, so the free tier suits debugging what happened this week rather than trend analysis over a quarter.
It's for teams shipping LLM features and agents who need to know what a request cost, why it was slow and where it failed, and who would rather instrument with OpenTelemetry than adopt a proprietary SDK they'll have to rip out later. Because it accepts OTLP, teams that already run OpenTelemetry can point an exporter at it without touching application code. Smaller teams get a free tier generous enough to instrument a side project or a pilot, and the two-seat limit is workable for a pair of engineers.
What makes it different is the standards posture. A lot of LLM observability products are OpenTelemetry-compatible in the sense that they can import it. telemetry.dev is native, so the same instrumentation that feeds it can feed your existing backend, and leaving later doesn't strand your tracing. The trade is that there's no self-hosted option and no open-source server, so the data lives with them. The capture controls matter for anyone handling regulated data, since prompts and completions can be kept out of storage per environment while the timing and cost metrics still flow. The pricing catalogue approach also means cost numbers appear for the major providers without a setup step.
Pricing is freemium. The Free plan is free forever with 10,000 ingestion units a month, seven-day retention, one project and two seats, and no credit card. Pro is $50 a month, or $25 at a founding rate for the first 25 customers, with 250,000 units, 30-day retention, five projects and five seats. Team is $100 a month for a million units, 90-day retention, unlimited projects and seats, and priority support. Paid plans can ingest past their limits without automatic overage charges. Docs, an OpenAPI reference and a demo booking form are on the site. Sign-up is self-serve, the docs cover the SDKs and the OTLP path, and a developer resources section on the site collects the integration guides.
Key Features
- OpenTelemetry-native LLM and agent tracing
- TypeScript and Python SDKs plus OTLP ingest
- LangChain, Vercel AI SDK and provider integrations
- Token, cost, latency and error tracking
- Per-environment prompt capture controls
- Dashboards for cost, errors and p95 latency
Pros & Cons
What we like
- Standard instrumentation that isn't locked to the vendor
- Free tier with no credit card
- Costs calculated automatically from token usage
- No automatic overage charges on paid plans
Room for improvement
- No self-hosted option
- Free tier retention is only seven days
- Founding Pro price is limited to 25 customers
- Younger product than the established APM vendors
Frequently Asked Questions
What is telemetry.dev?
Is telemetry.dev free?
How do I send data to it?
What is an ingestion unit?
Best For
Featured in
Alternatives to telemetry.dev

Kevin Gabeci
Solo developer building web apps, cozy browser games, and AI creator toolkits.

SoloDevStack
A solo developer blog built on head-to-head tool comparisons, 580+ posts deep.

Codedex
A gamified, story-driven platform that teaches Python, web dev, and more like an RPG quest
Vibe Built
Building real apps with agentic AI. What worked, what broke, what shipped.
Reviews (0)
Badge builder
Add telemetry.dev to your website
Choose a badge style and size, preview it here, then copy the generated HTML. Badge images are self-contained SVGs and do not require an external script.

<a href="https://toolindex.net/tools/telemetry-dev?ref=badge" target="_blank" rel="noopener">
  <img src="https://toolindex.net/badge/telemetry-dev/medium.svg" alt="telemetry.dev - Listed on Tool Index" width="180" height="50" />
</a>How to use the badge
- 1. Pick the style, size, and theme that fit your layout.
- 2. Copy the generated HTML from the code block.
- 3. Paste it into your footer, homepage, or press page.
Standard badge available
The standard listing badge is available now. Score and circle badges are limited to tools currently ranked in the top 10 of a category.
Badge clicks return visitors to this profile with a referral tag so the source remains identifiable.
Related Tools
Kevin Gabeci
Solo developer building web apps, cozy browser games, and AI creator toolkits.

Coolify
Self-hostable, open source alternative to Heroku and Netlify

Warp
The modern terminal reimagined with AI and collaboration

Bolt.new
Prompt-to-deployed full-stack app inside the browser
Work on telemetry.dev? Request listing access or correction