BeCharts
Online chart maker with 100+ templates, 20+ chart types, and PNG, SVG, and PDF export
Gallery
About BeCharts
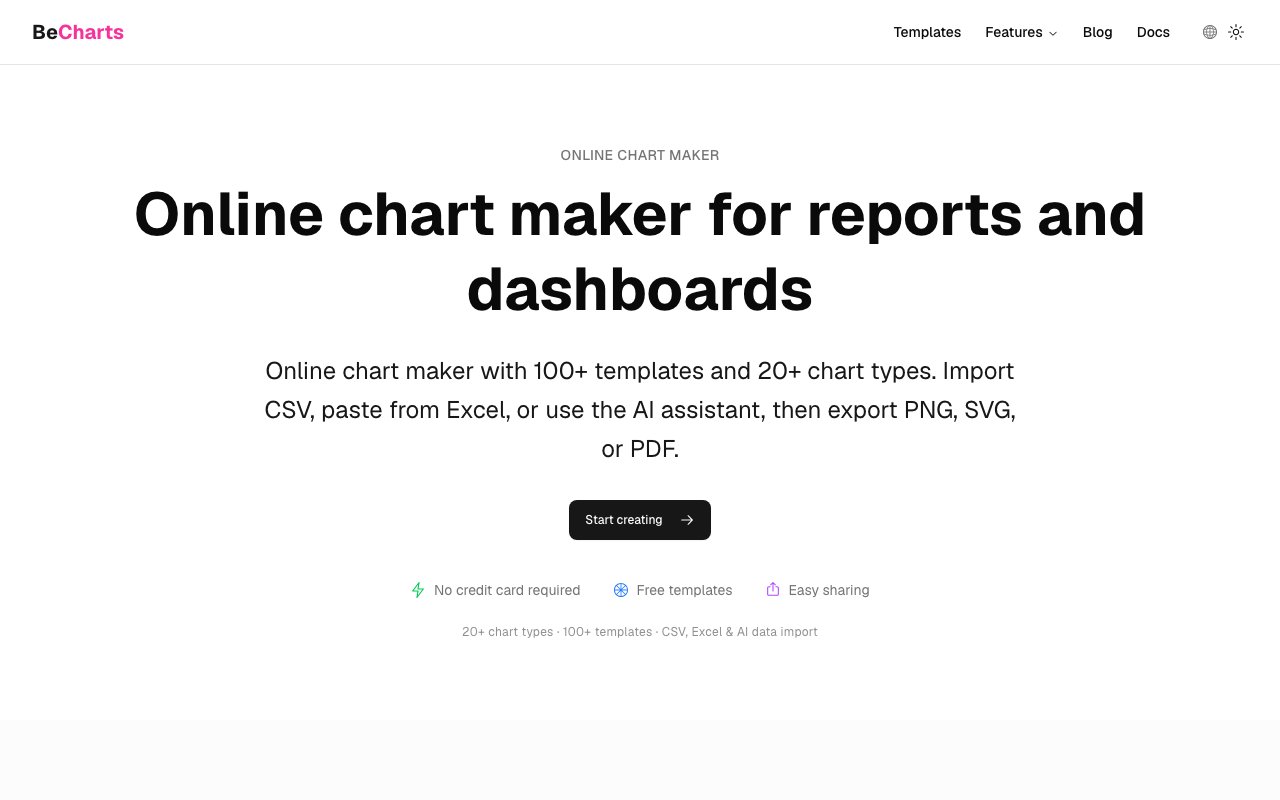
BeCharts is an online chart maker for turning spreadsheets into clean, presentable visuals without touching design software or a charting library. You bring the data, pick from more than a hundred ready-made templates, adjust colors and labels until it matches your brand, and export the result as a high-resolution PNG, a vector SVG, or a print-ready PDF. The whole thing runs in the browser, and right now every core feature is free with no credit card required.
The problem it solves is the awkward middle ground most people live in. Excel and Google Sheets can make charts, but the defaults look dated and customization fights you at every step. Design tools like Figma make beautiful charts if you're willing to draw them by hand and redraw them when the numbers change. Charting libraries give developers full control but ask you to write code. BeCharts sits between all of those, giving non-developers a proper editor where the chart is generated from real data but styled like something a designer made. When the numbers change, you update the data and the chart follows, which is exactly the part hand-drawn charts get wrong.
The range of chart types goes well past the usual suspects. Alongside bar, line, pie, and scatter charts, there are radar, sankey, sunburst, treemap, heatmap, funnel, gauge, candlestick, boxplot, polar, parallel coordinates, calendar, chord, graph, matrix, theme river, and combo charts, more than twenty types in total. That matters because the moment you need something like a sankey diagram for a flow analysis or a candlestick chart for market data, most simple chart makers hit a wall and you're back to hunting for a specialist tool.
Getting data in is flexible. You can upload a CSV, paste cells straight from Excel or Google Sheets, or pull from live data sources including World Bank indicators, EIA energy data, stock APIs, and weather data. The live sources are a quietly useful touch, because a lot of charting work starts with hunting down a public dataset, downloading it, cleaning it, and only then getting to the actual chart. Being able to pull World Bank or stock data directly into the editor collapses that whole preamble into a couple of clicks.
There's also a built-in AI assistant that accepts a plain-language description of what you want, which lowers the barrier further for anyone who'd rather describe a chart than configure one. Once the data lands, the editor handles the styling side, and the template library means most charts start from something already polished rather than a blank canvas. That's the practical difference between this and starting in a spreadsheet, where you build up from an ugly default. Here you start from a finished-looking chart and swap in your own numbers, which is faster and tends to end somewhere better.
The audience is deliberately broad. BeCharts pitches itself at marketers building report graphics, analysts who need something more presentable than a spreadsheet screenshot, students and educators preparing academic work, and founders putting together decks and blog posts. The common thread is people who work with data regularly but don't want to learn D3 or wrestle with a design tool to communicate it. If you're a developer who already lives in a charting library, this probably isn't aimed at you. For everyone else, it's the difference between a chart that gets the point across and one that looks like it belongs in the final document.
What makes it stand out against other browser-based chart makers is the combination of depth and openness. Twenty-plus chart types with a hundred-plus templates is unusual coverage for a free tool, the live data connections save the export-and-reimport shuffle for common public datasets, and vector SVG plus PDF export means the output holds up in print and at any size, not just as a web image. The SVG option deserves a specific mention, because a lot of free chart makers cap you at a raster PNG, which falls apart the moment it lands in a printed report or gets scaled up on a slide. Getting proper vector output for free is rarer than it should be.
On pricing, the current posture is unambiguous. Templates, all chart types, data import, customization, and PNG, SVG, and PDF export are all free with no credit card. The site says advanced premium features are planned for future paid plans while keeping a generous free tier, so the honest read is that BeCharts is in a land-grab phase and the free access is genuinely broad today. If you need charts for a report this week, there's no cost barrier to finding out whether it fits, and worst case you walk away with a folder of exported SVGs that are yours regardless.
Key Features
- More than 20 chart types
- 100+ ready-made chart templates
- CSV upload and spreadsheet paste import
- Live data from World Bank, EIA, stocks, and weather
- AI assistant for plain-language chart creation
- PNG, SVG, and PDF export
Pros & Cons
What we like
- Every core feature is currently free with no credit card
- Unusually wide chart type coverage including sankey, chord, and candlestick
- Vector SVG and PDF export hold up in print
- Live public data sources skip the download-and-import step
Room for improvement
- Paid plans are planned, so the all-free posture may narrow
- No collaboration or team features advertised
- Browser editor only, no API or embed workflow mentioned
- Younger product without a large template community
Frequently Asked Questions
What is BeCharts?
Is BeCharts free?
What chart types does BeCharts support?
Who is BeCharts for?
Best For
Featured in
Alternatives to BeCharts

Framer
Visual website builder that lets designers ship production-grade marketing sites with real CMS, SEO controls, and code components.

Tailwind CSS
Rapidly build custom designs without leaving your HTML

Apatero Studio
Creator studio for AI image, video, audio, 3D, and avatars. Every model worth using, in one workspace.

Pixel Painters
Unlimited graphic design subscriptions built only for churches and ministries
Reviews (0)
Badge builder
Add BeCharts to your website
Choose a badge style and size, preview it here, then copy the generated HTML. Badge images are self-contained SVGs and do not require an external script.

<a href="https://toolindex.net/tools/becharts?ref=badge" target="_blank" rel="noopener">
  <img src="https://toolindex.net/badge/becharts/medium.svg" alt="BeCharts - Listed on Tool Index" width="180" height="50" />
</a>How to use the badge
- 1. Pick the style, size, and theme that fit your layout.
- 2. Copy the generated HTML from the code block.
- 3. Paste it into your footer, homepage, or press page.
Standard badge available
The standard listing badge is available now. Score and circle badges are limited to tools currently ranked in the top 10 of a category.
Badge clicks return visitors to this profile with a referral tag so the source remains identifiable.
Related Tools
Apatero Studio
Creator studio for AI image, video, audio, 3D, and avatars. Every model worth using, in one workspace.
Tailwind CSS
Rapidly build custom designs without leaving your HTML

Figma
Collaborative interface design tool

Marvel
Lightweight prototyping platform for turning images and screens into clickable mobile and web prototypes.
Work on BeCharts? Request listing access or correction