
CostCompass
Cost-of-living comparisons from real scraped data, not crowdsourced estimates
Gallery
About CostCompass
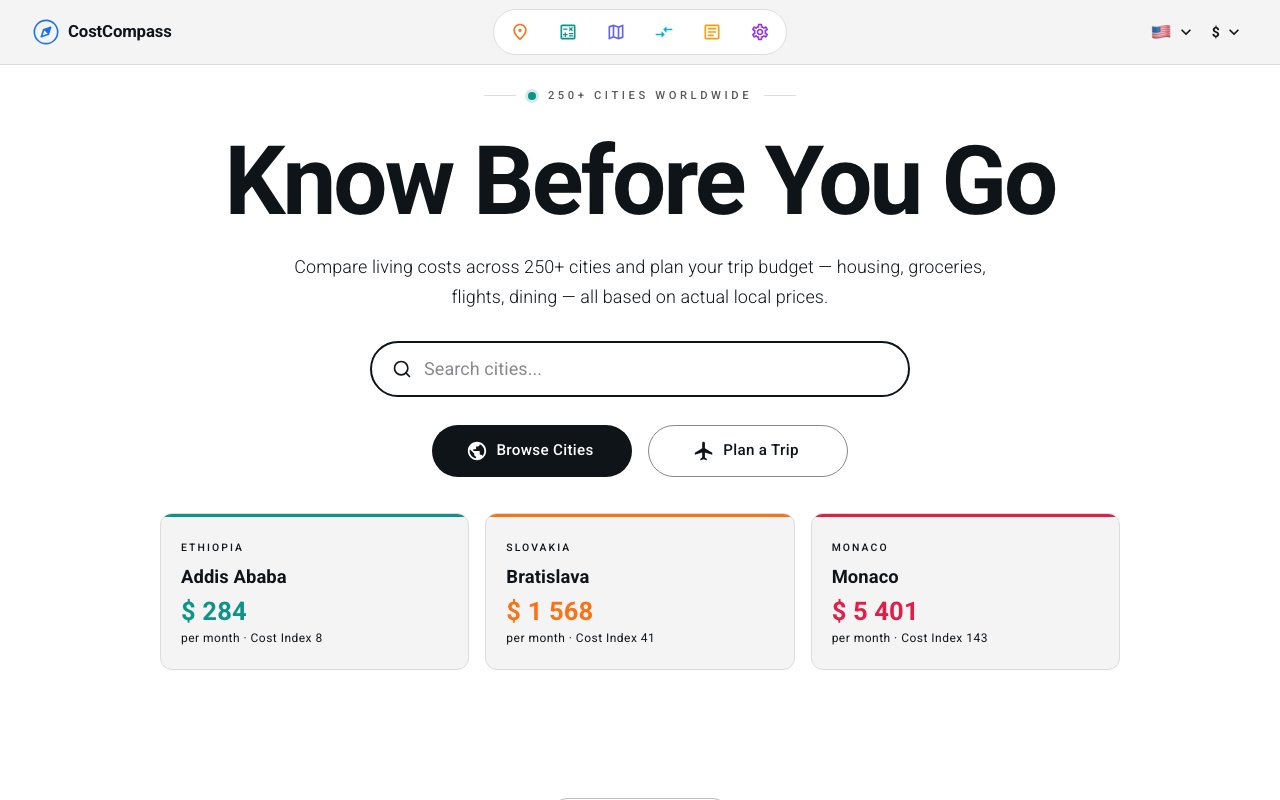
CostCompass is a cost-of-living comparison tool that pulls data from local sources instead of relying on crowdsourced surveys. It covers over 250 cities worldwide and updates weekly, scraping prices from supermarkets, real estate portals, and transit operators. If you are evaluating where to live or travel and want numbers grounded in actual listings rather than user submissions, this is the pitch.
The problem with most cost-of-living sites is data quality. Crowdsourced numbers depend on who contributes and when, which can skew results toward expats or tourists rather than locals. CostCompass takes a different approach, pulling from local sources directly. Groceries come from supermarkets, housing from real estate portals, transportation from transit operators. The site emphasizes no surveys and no estimates.
The interface offers three main ways to use the data. City profiles give you a detailed breakdown by category, covering housing, groceries, restaurants, transport, utilities, entertainment, healthcare, and clothing. A comparison tool lets you set two cities side by side and see the differences across every category. A trip calculator estimates daily budgets at three tiers, budget, mid-range, and luxury, for over 250 destinations.
There is also an interactive map for visual exploration. If you want to browse regions rather than search for specific cities, the map gives you a geographic entry point into the data.
The audience is broad. Remote workers deciding where to relocate, digital nomads comparing bases, travelers planning budgets, or anyone curious about how their city stacks up against somewhere else. The value is in the sourcing, not a novel interface. If you trust scraped data over survey data, this is the tool that delivers it.
The site appears to be free to use. There is no visible paywall, subscription, or pricing page. Data updates weekly, which keeps it reasonably current without requiring real-time feeds. No contact email is published, so support would likely go through whatever form or channel they surface later.
Where it stands apart is the data sourcing commitment. Plenty of tools compare cost of living, but most rely on user contributions. CostCompass bets that automated local scraping produces more reliable numbers, and for someone making a real relocation or travel decision, that reliability might matter more than a familiar brand name.
Key Features
- Weekly data updates from local scrapers
- City profiles with category breakdowns
- Side-by-side city comparison tool
- Trip budget calculator at three spending tiers
- Interactive global map view
- Coverage of over 250 cities worldwide
Pros & Cons
What we like
- Data comes from real listings rather than surveys
- Weekly updates keep numbers reasonably current
- Free to use with no visible paywall
- Covers housing, groceries, transport, and more
Room for improvement
- Scraper quality depends on source availability per city
- No contact information visible on the site
- Smaller city coverage compared to survey-based giants
- No mobile app, web only
Frequently Asked Questions
What is CostCompass?
Is CostCompass free?
How is CostCompass different from Numbeo?
Who is CostCompass for?
Best For
Featured in
Alternatives to CostCompass
View allTrello
The kanban board that taught the rest of the industry what a card was

Confluence
Atlassian's long-running team wiki that anchors many enterprise knowledge stacks
Asana
Project management for teams that live in projects, tasks and dependencies

Slack
Where work communication happens
Reviews (0)
Badge builder
Add CostCompass to your website
Choose a badge style and size, preview it here, then copy the generated HTML. Badge images are self-contained SVGs and do not require an external script.

<a href="https://toolindex.net/tools/costcompass?ref=badge" target="_blank" rel="noopener">
  <img src="https://toolindex.net/badge/costcompass/medium.svg" alt="CostCompass - Listed on Tool Index" width="180" height="50" />
</a>How to use the badge
- 1. Pick the style, size, and theme that fit your layout.
- 2. Copy the generated HTML from the code block.
- 3. Paste it into your footer, homepage, or press page.
Standard badge available
The standard listing badge is available now. Score and circle badges are limited to tools currently ranked in the top 10 of a category.
Badge clicks return visitors to this profile with a referral tag so the source remains identifiable.
Related Tools
Kevin Gabeci Toolkits
Seven AI toolkits for writing books, making music, cutting video, and building agents.
Cal.com
Open source scheduling infrastructure for everyone
Slack
Where work communication happens

CalendHub
Smart scheduling and calendar management for teams
Work on CostCompass? Request listing access or correction