Honeycomb
High-cardinality observability for distributed systems. Query traces by any field without pre-defining indexes.
Gallery
About Honeycomb
Honeycomb is observability for engineers who got tired of dashboards lying to them. It's built around high-cardinality, high-dimensionality query workloads, which is the technical phrase for "ask any question of your traces, even if you didn't plan for it."
Founded by Charity Majors and Christine Yen (both ex-Parse/Facebook) in 2016, Honeycomb has a strong opinionated stance on what observability should look like in distributed systems.
If you're shopping observability tools today, Honeycomb sits in a different category from Datadog and New Relic. This breakdown explains the difference.
What Honeycomb actually does
Honeycomb ingests structured events (traces, logs, metrics) and lets you query them across any dimension. The core query language, BubbleUp, lets you ask "what's different about the slow requests?" and surfaces patterns automatically.
The data model is one wide event per unit of work, with arbitrarily many fields. Customer ID, request path, region, build SHA, feature flag state, all on the same row. Query any field, group by any combination, no pre-aggregation needed.
This is fundamentally different from Datadog's metrics-and-logs split or Prometheus' time-series model. The trade-off is cost (high-cardinality data is expensive) and learning curve (you have to think differently).
Who Honeycomb is for
Engineers running production microservices who debug live incidents. The classic Honeycomb story is "we couldn't figure out why latency spiked, opened Honeycomb, BubbleUp pointed at one customer ID, fixed in 10 minutes."
SRE teams that have outgrown Prometheus and Grafana for distributed tracing love Honeycomb. The query model is purpose-built for the kind of investigations that DataDog APM struggles with.
It's overkill for monolithic apps with simple infrastructure. If you have a Rails app on Heroku, Sentry plus basic metrics are enough. Honeycomb earns its keep when you have 50+ services and incidents that span multiple teams.
Pricing breakdown
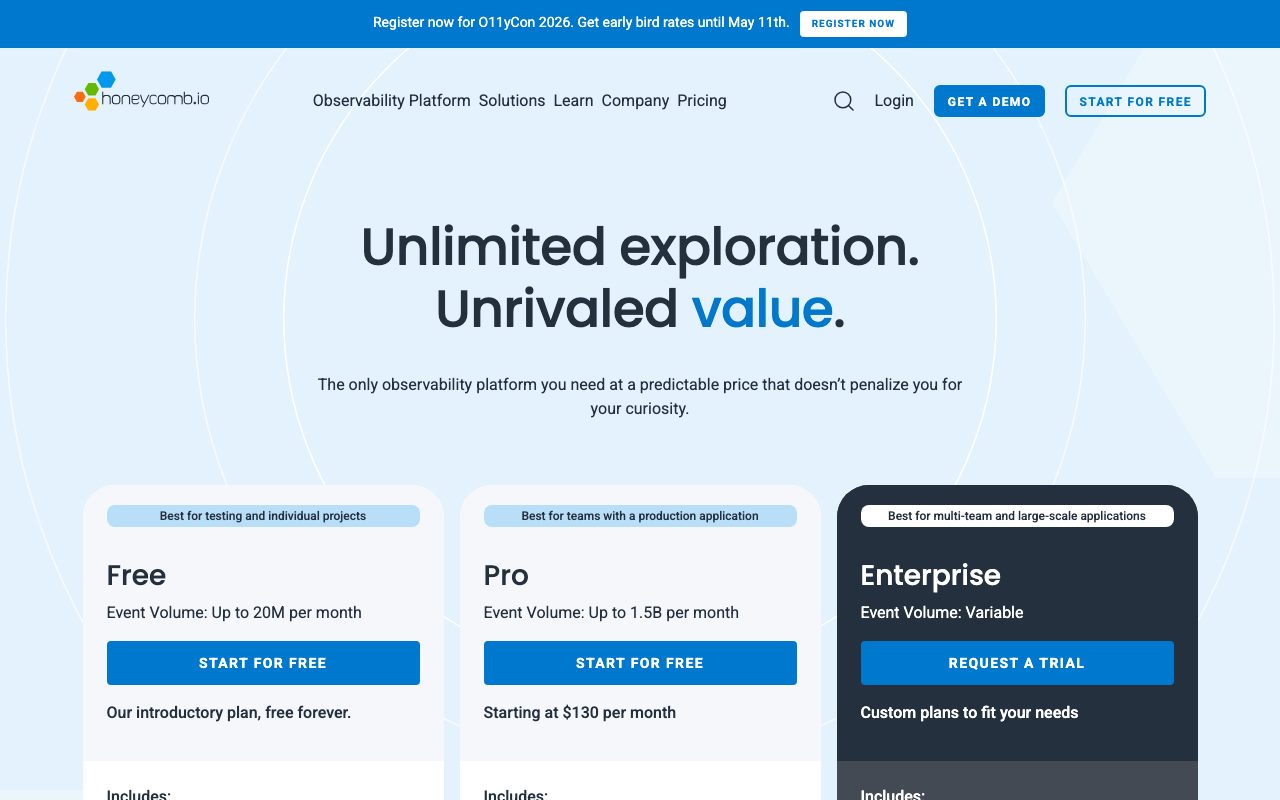
Free tier includes 20M events/month and 60-day retention. Generous enough for hobby projects and small startups.
Pro is $130/month for 100M events with 60-day retention, advanced features like BubbleUp and SLOs. Enterprise is custom-quoted with higher event volumes, longer retention, and dedicated support.
The pricing model is event-based, not host-based. This is friendlier than Datadog's per-host model for high-cardinality workloads but can surprise teams that hadn't budgeted for event volume.
Standout features
BubbleUp
BubbleUp is Honeycomb's anomaly detection. Select a slow region of your latency graph, click BubbleUp, and Honeycomb shows what's different about events in that region versus baseline. Customer X, build Y, region Z, all surfaced automatically.
This feature alone cuts incident time meaningfully. Most observability tools require you to know what to query. BubbleUp tells you.
SLOs done right
Honeycomb's SLO product handles burn rate alerts, error budgets, and multi-window evaluations. The implementation matches Google's SRE book recommendations more closely than most tools.
OpenTelemetry native
Honeycomb was an early backer of OpenTelemetry. You instrument your code with OTel, send to Honeycomb, no proprietary agent required. This means you can switch tools later without re-instrumenting.
Honeycomb's biggest insight: observability isn't about dashboards, it's about asking new questions in real time. Most tools force you to predict the question.
Honest tradeoffs
The learning curve is steep. Engineers who've used Datadog or New Relic for years have to unlearn habits. The Honeycomb mental model takes weeks to internalize.
Cost can spiral if you're not careful with cardinality. A field like `request_id` on every event multiplies storage. Most teams hit a sticker shock moment in month 2 and learn to be intentional about what they instrument.
The UI is functional but not beautiful. It's clearly built by engineers for engineers. If you want pretty dashboards for a board deck, Honeycomb isn't your tool. Datadog is.
Honeycomb vs alternatives
Versus Datadog: Datadog is the broad observability suite (metrics, logs, APM, RUM, infra, security). Honeycomb is depth in trace-based observability. Many teams use both, with Honeycomb for incident investigation and Datadog for everything else. If forced to choose, pick based on your dominant pain.
Versus New Relic: New Relic has rebuilt around their NerdGraph platform and offers free tier with 100GB ingest. Strong dashboards, weaker high-cardinality story. Honeycomb wins on raw query power.
Versus Lightstep / ServiceNow: Lightstep had similar positioning before ServiceNow acquired it. Roadmap and pricing have been less developer-friendly post-acquisition. Honeycomb is the cleaner choice today.
Versus Grafana + Tempo: Self-hosted observability stack. Cheaper if you have engineers to run it. Honeycomb's BubbleUp and managed experience justify the price for teams without dedicated platform engineers.
Browse best observability tools or see tools for SRE teams for related stack.
Bottom line
Honeycomb is the observability tool I'd recommend to a team that takes incident response seriously. The investment in learning it pays back in faster mean-time-to-resolution.
It's not the right tool for everyone. Small teams or simple apps don't need it. But for engineering organizations running real microservice infrastructure, the high-cardinality query model is genuinely better than the alternatives.
Try the free tier. Even 20M events is enough to instrument a meaningful service and feel the difference.
Instrumentation patterns that work
The Honeycomb mental model rewards wide events with high-cardinality fields. Each unit of work (HTTP request, queue job, scheduled task) emits one event with all relevant context: customer ID, request path, build SHA, feature flags, timing breakdown.
The instrumentation libraries (Beelines for Go, Ruby, Python, Node) make this straightforward. OpenTelemetry instrumentation also works and is the recommended path for new projects.
Auto-instrumentation captures basic HTTP and database fields. Manual instrumentation adds the business context that makes Honeycomb queries actually useful: customer ID, plan tier, feature flag state.
What to instrument
Start with one service. Pick the one that gets paged most often. Add basic HTTP/DB auto-instrumentation. Then add manual context for the top 5 fields you'd want to filter by during an incident.
Don't try to instrument everything at once. Honeycomb rewards iteration. Instrument, hit incidents, learn what's missing, instrument more.
Common high-value fields: customer ID, request path, status code, route handler, build SHA, deployment region, feature flag values. These give you 90% of incident debugging power.
Honeycomb for SLOs and alerting
The SLO product handles burn rate alerting better than most observability tools. Define an SLO (99.9% of requests under 500ms), Honeycomb tracks the error budget, and burn rate alerts fire when you're consuming budget faster than expected.
Burn rate alerting is more sophisticated than threshold alerting. A 1-hour burn rate burning 14x indicates urgency. A 6-hour burn rate burning 5x indicates a slower problem. Different alert windows fire on different patterns.
The implementation matches Google's SRE handbook recommendations closely. SRE teams find Honeycomb's SLO product feels right immediately.
Alert routing
Honeycomb integrates with PagerDuty, Opsgenie, Slack, and webhook destinations. Triggers (Honeycomb's word for alerts) fire on query results crossing thresholds. Set them up alongside SLOs for full alert coverage.
Common Honeycomb questions
How does Honeycomb handle log data?
Honeycomb is event-based, which logs map to nicely. Each log line becomes an event with timestamp, level, message, and any structured fields. The query model is the same as for traces.
For pure log search (grep through millions of lines), tools like Elasticsearch or Datadog Logs are better. Honeycomb's strength is querying structured event data, not full-text log search.
What about metrics?
Honeycomb supports metric ingestion and querying, but it's not the primary use case. If you have heavy metric workloads (Prometheus-style), use Honeycomb for tracing/events and pair with a metrics-specific tool.
Most teams using Honeycomb pair it with Prometheus or Grafana Cloud for metrics. The combination covers different observability needs.
Cost optimization tips
Honeycomb's pricing scales with event volume. Common tactics for managing cost: sampling (drop fraction of events), filtering (only send important fields), and aggressive cardinality discipline.
The Honeycomb team is helpful with cost optimization. They'd rather have you optimize than churn. Reach out to your account manager if costs surprise you.
For more SRE tooling, see best distributed tracing tools or tools for platform engineers.
Honeycomb in the broader observability landscape
The observability market is bifurcating. Datadog and similar broad suites cover the "we want one tool for everything" use case. Honeycomb and Lightstep-class tools cover the "we want depth in distributed tracing" use case.
Most large engineering organizations end up with multiple observability tools. The question is which gets which workload. Honeycomb typically wins the trace-based debugging use case.
If your organization is making the observability investment for the first time, evaluate Honeycomb against managed Grafana + Tempo. The latter is cheaper if you have platform engineers; the former is faster to deploy.
For more SRE tooling, see best observability tools.
Tutorial / Demo
Key Features
- High-cardinality querying without pre-defined indexes
- Native OpenTelemetry ingest
- BubbleUp diff queries for incident triage
- Service maps generated from real traces
- Triggers and SLO tracking on event data
Pros & Cons
What we like
- Truly handles high cardinality without surprise bills
- Query model fits how engineers actually debug
- Generous free tier compared to Datadog
Room for improvement
- Steeper learning curve if your team has never used tracing
Frequently Asked Questions
Does Honeycomb have a free tier?
Honeycomb vs Datadog, which should I pick?
Can Honeycomb ingest OpenTelemetry?
Is Honeycomb good for logs?
What's BubbleUp and is it actually useful?
Best For
Featured in
Tags
Alternatives to Honeycomb
View all
Rollbar
Error monitoring with automated grouping and AI-assisted suggestions for which errors to actually fix first.

PostHog
All-in-one product analytics, feature flags, and session replay
Better Stack
Uptime monitoring, on-call scheduling, log management, and status pages bundled into one tool.
Sentry
Error monitoring and performance tracing that tells you exactly which line broke production for which user.
Reviews (4)
Pulled its weight from week one
Honeycomb is one of those tools you stop noticing because it just works. What stands out is how generous free tier compared to Datadog. The native OpenTelemetry ingest is more useful than I expected. It fits well for platform teams adopting OpenTelemetry org-wide.
Pros
- Query model fits how engineers actually debug
- Truly handles high cardinality without surprise bills
Honeycomb, better than expected
Skeptical at first because Honeycomb looked too simple. It's not. Real selling point: generous free tier compared to Datadog. Worth calling out the native OpenTelemetry ingest too. Found it works best for incident response when you do not know what to query yet. Sticking with Honeycomb.
Honest take after six months
The pitch for Honeycomb sounded too good to be true. Mostly true. What stands out is how query model fits how engineers actually debug. Got real value out of high-cardinality querying without pre-defined indexes. Found it works best for incident response when you do not know what to query yet. One thing that bugs me: steeper learning curve if your team has never used tracing. Hard to imagine going back to my previous setup.
Pros
- Truly handles high cardinality without surprise bills
- Query model fits how engineers actually debug
Half a star away from a wholehearted yes
Honest take: Honeycomb delivers most of what the marketing promises. Genuine strength: query model fits how engineers actually debug. Not perfect but better than the alternatives I tried.
Cons
- Steeper learning curve if your team has never used tracing
Badge builder
Add Honeycomb to your website
Choose a badge style and size, preview it here, then copy the generated HTML. Badge images are self-contained SVGs and do not require an external script.
<a href="https://toolindex.net/tools/honeycomb?ref=badge" target="_blank" rel="noopener">
  <img src="https://toolindex.net/badge/honeycomb/medium.svg" alt="Honeycomb - Listed on Tool Index" width="180" height="50" />
</a>How to use the badge
- 1. Pick the style, size, and theme that fit your layout.
- 2. Copy the generated HTML from the code block.
- 3. Paste it into your footer, homepage, or press page.
Standard badge available
The standard listing badge is available now. Score and circle badges are limited to tools currently ranked in the top 10 of a category.
Badge clicks return visitors to this profile with a referral tag so the source remains identifiable.
Related Tools

Kevin Gabeci
Solo developer building web apps, cozy browser games, and AI creator toolkits.

Warp
The modern terminal reimagined with AI and collaboration

GitHub
Where the world builds software
Coolify
Self-hostable, open source alternative to Heroku and Netlify